The S&P 500® Dividend Points Index tracks dividend payments of S&P 500 constituents, based on a fixed initial market capitalization, independent of equity price changes. The index cannot be invested in directly, but it is tracked by futures contracts listed on the Chicago Mercantile Exchange (CME). Currently, the annual dividend futures are available up to 10 years forward.
The S&P 500 Dividend Points Index represents cumulative cash dividends paid over a defined period of either one quarter or one year. At the start of the next period, the index is reset to zero so that it reflects dividends paid in discrete periods that coincide with the expiration of S&P 500 futures.
Dividend Futures Use Cases
One important use case of dividend futures (and the OTC swap markets that emerged prior to the futures markets) is dividend risk hedging in structured equity products sold by investment banks, which have been popular in Europe and some Asian countries, such as Korea and Japan.
These products offer equity-linked returns to end clients, although the payouts are usually linked to price changes rather than total returns in the underlying equity index. If a bank hedges with an index futures or basket of equities, they are left with exposure to dividends, which has significant implication on hedging risk.
The dividend futures market enables banks to reduce some of their dividend exposure by selling dividend futures to sophisticated investors. The supply of dividends and the corresponding low demand results in low implied future dividend growth and attracts hedge funds to the dividend market, adding further liquidity and increasing the appeal of dividend transactions. Asset owners may also be willing to buy dividend futures in order to hedge out dividend fluctuation risk in order to better match their liability streams.
How Dividend Futures Work
If a long position in the dividend futures contract is held to expiration, the investment return depends on the difference between the index dividends per share actually paid on the S&P 500 and the price of the dividend futures at the time of the initial investment. The dividend futures price should reflect the market’s best guess as to what the fair value of the future dividends will be, although short-term supply and demand will cause prices to fluctuate around fair value.
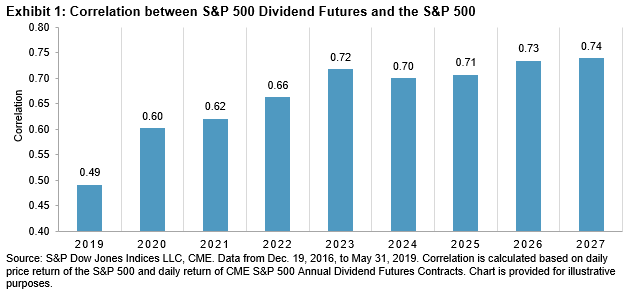
According to the dividend discount model, the intrinsic value of a stock equates to the present value of a stock’s future dividends. Therefore, dividend futures prices would generally benefit from stock price increases, especially when looking at a long horizon. In addition, dividend payments tend to be fairly well estimated close to a year before they are paid. Therefore, as the futures get closer to expiry, the futures price sensitivity to stock price decreases (see Exhibit 1).
Dividend Futures versus Estimated Dividend
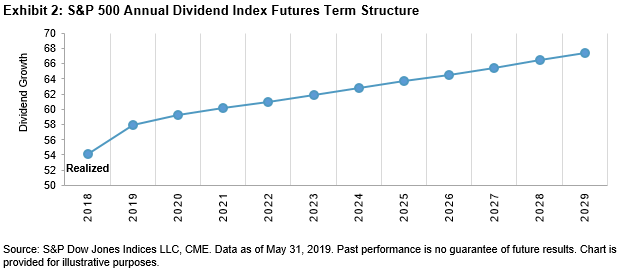
As of May 31, 2019, the December 2029 S&P 500 Annual Dividend Futures contract priced to 67.4 versus 57.9 for the 2019 contract. This implies a modest 1.5% annualized dividend growth rate over the next 10 years (see Exhibit 2). This growth rate is much lower when compared with the 6% annual dividend growth rate from the past 49 years (from 1970 to 2018).
When we compare the dividend futures prices with forecasted dividends, we can also see a clear gap. The dark blue bar in Exhibit 3 reflects the current dividend futures price; the yellow bars reflect the analyst consensus estimate.
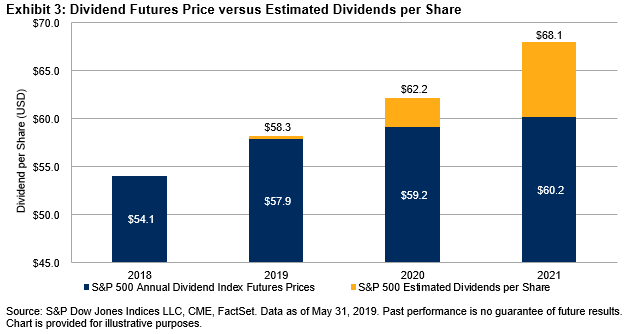
Both the historical dividend growth trend and the dividend estimates seem to indicate that dividend futures are undervalued and may have a 4%-5% upside annually for a buy and hold strategy. One explanation for this “dividend premium” is that banks’ activity creates natural sellers of dividend futures, with a resulting potential return for buyers. Another explanation is the perceived risk of negative dividend surprises. In that sense, the return is simply compensation for risk.
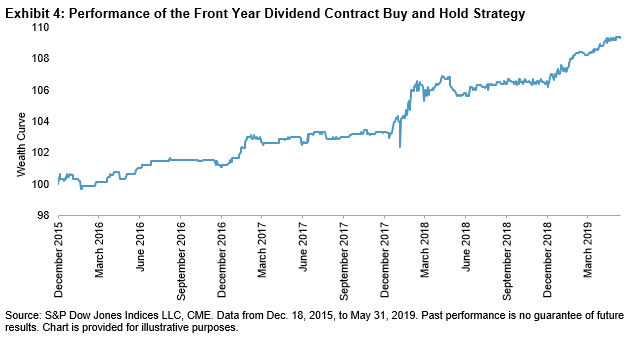
Exhibit 4 demonstrates a buy and hold strategy for the front year dividend futures contract—it longs the next annual dividend futures contract for a year, and when the contract expires, it rolls into the next year’s contract. Such a strategy returned 2.6% per year with a volatility of 2.3% from Dec. 18, 2015, to May 31, 2019.