Get Indexology® Blog updates via email.

In This List

Q1 2020 Performance Review for the S&P Risk Parity Indices

Passive Investing: An Evergreen Option

Glory or Embarrassment?

Tracking The Cost of Retirement Income

Golden Eye of the Storm

Q1 2020 Performance Review for the S&P Risk Parity Indices

Contributor Image
Rupert Watts

Head of Factors and Dividends

S&P Dow Jones Indices

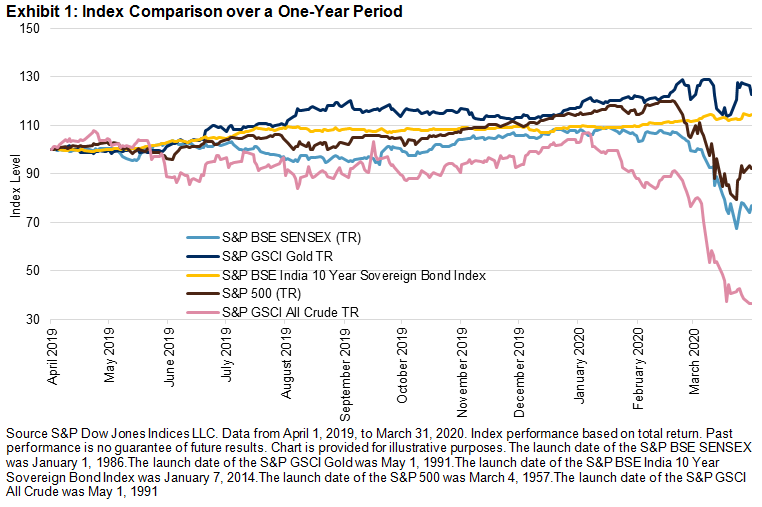
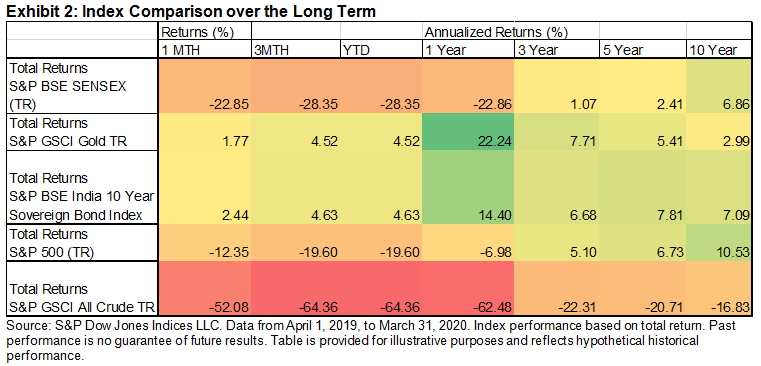
It comes as no surprise that the COVID-19 pandemic had a profound effect on global markets in the first quarter of 2020. The S&P 500® suffered steep declines, and U.S. Treasury yields fell (prices rose) as investors favored a flight to quality. In commodities, the S&P GSCI ended March down an extraordinary 29.4%, the largest monthly drop in performance in its almost 29-year history.

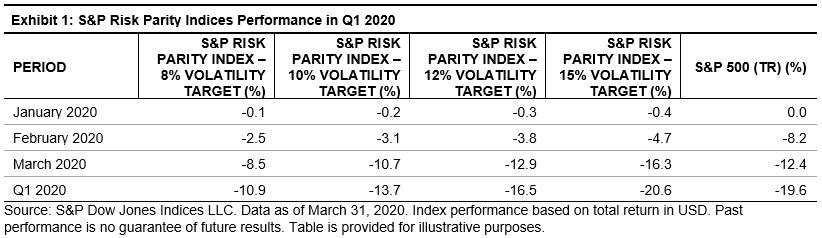
Similarly, the first quarter proved a challenging one for the S&P Risk Parity Indices, with all of the volatility targets posting double-digit losses (see Exhibit 1). This was to be expected given the sudden and dramatic decline in the aforementioned asset classes.

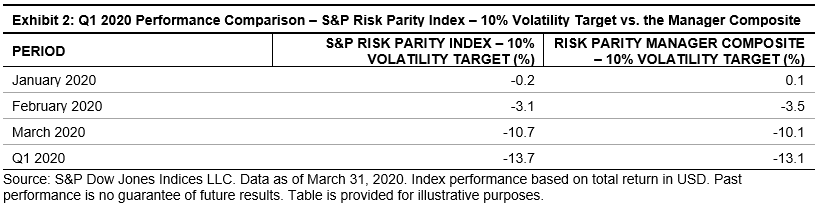
Since their launch in 2018, the S&P Risk Parity Indices have been adopted by several asset owners and asset managers as a benchmark for active risk parity funds. As Exhibit 2 shows, the performance of the S&P Risk Parity Index – 10% Volatility Target was very much in line with the manager composite for the first quarter.

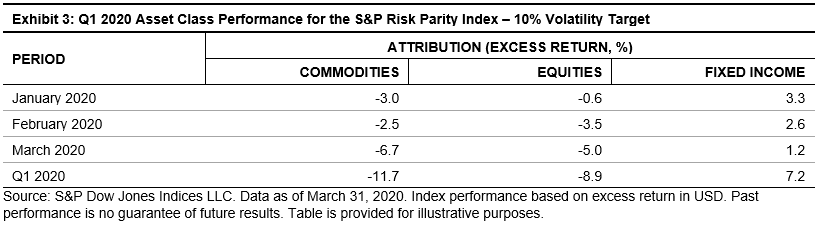
As we continue to analyze the S&P Risk Parity Index – 10% Volatility Target, let’s examine the asset class performance attribution (using excess returns). The S&P Risk Parity Indices comprise three asset class sub-components: equities, fixed income, and commodities.

As Exhibit 3 shows, negative performance for the first quarter was driven by commodities and equities, down 11.7% and 8.9%, respectively. Fixed income finished the quarter up 7.2%, which, despite its comparative weight advantage, was not enough to offset losses in the other two asset classes.

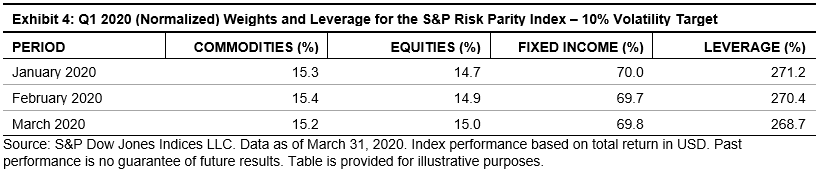
When it comes to weighting assets, risk parity attempts to maximize the diversification benefits by allocating capital such that each asset class contributes an equal amount of volatility to the total volatility of the portfolio. Thus, less-volatile asset classes, like fixed income, are typically assigned a higher weight. Additionally, the index is typically leveraged to meet the stated volatility target to achieve a stable risk profile.

As Exhibit 4 shows, the leverage decreased only slightly in March, but it is anticipated that April will be more pronounced as the impact of March is fully absorbed. That being said, dramatic changes are not expected given the fact that the look-back window on the volatility calculation is fairly long (15 years).

While markets started April on the front foot, we are not out of the woods yet when it comes to uncertainty over the coronavirus. Although the first quarter was a challenging one for the S&P Risk Parity Indices, they still offer the potential to help improve risk-adjusted returns over the long term. By placing each asset class on an equal volatility footing, the diversification benefits have a better chance of shining through compared to traditional fixed allocation approaches.

The posts on this blog are opinions, not advice. Please read our Disclaimers.

Passive Investing: An Evergreen Option

Contributor Image
Koel Ghosh

Former Head of South Asia

S&P Dow Jones Indices

John C. Bogle is quoted as saying, “the idea that a bell rings to signal when investors should get into or out of the market is simply not credible. After nearly 50 years in this business, I do not know of anybody who has done it successfully and consistently. I don’t even know anybody who knows anybody who has done it successfully and consistently.”[1]

The current COVID-19 situation has created an unprecedented outlook that calls for reinvention and new solutions. Markets across asset classes are witnessing substantial volatility, which is making investment decisions more challenging. Each asset class with its own characteristics is highlighting trends, which is keeping investors perplexed.

Comparing some global trends with those from India for the one-year period ending March 31, 2020, the S&P BSE SENSEX touched historical lows, just as other global indices such as the S&P 500® have. On the fixed income side, the S&P BSE India 10 Year Sovereign Bond Index has held its ground and been range-bound, though it has also seen some minimal declines. The S&P GSCI All Crude, a subindex of the S&P GSCI that is designed to measure the performance of the crude oil commodity market, recorded its 10-year low on April 1, 2020. The S&P GSCI Gold, a subindex of the S&P GSCI that is designed to measure the performance of COMEX gold futures, rose in March 2020 but with some volatility.

Selecting the best route or time to park funds in such times is a challenge for even the best professionals in the field with years of experience. Passive investing or index-based investing has many benefits that make it an evergreen option in asset allocation. Index-based investing provides allocation to a broadly diversified portfolio at a low cost. An index, based on transparent rules by an independent provider, offers a standard approach without the bias of a fund manager. Passive investing involves the buying and holding of a basket of securities in a particular index in proportion to the securities’ weight in the index, thereby offering protection from concentration risk.

A dilemma faced by many investors is the availability of a plethora of options around them and making the decision of what is the best choice. The best way to counter that is to make the process simple. Indices serve as transparent measures of market compositions and trends, making them essential for building investment confidence. In some cases, indices can make substantial contributions to democratizing market access. Indices define asset classes, geographies, strategies, and themes for the investment community and thereby form the basis of many index mutual funds and exchange-traded funds.

[1] Common Sense on Mutual Funds: New Imperatives for the Intelligent Investor

The posts on this blog are opinions, not advice. Please read our Disclaimers.

Glory or Embarrassment?

Contributor Image
Anu Ganti

U.S. Head of Index Investment Strategy

S&P Dow Jones Indices

Active funds generally lagged their passive benchmarks in 2019, but the market environment in 2020 has already shifted radically. Volatility has skyrocketed as the S&P 500® and other indices have fallen. Ironically, it is precisely in a time such as this, when absolute returns are hard to come by, that relative returns might be most readily attainable. This is true not just for traditional stock pickers, but also for active managers looking to express tactical views on the business cycle through sector rotation.

We can analyze the opportunities available by examining changes in dispersion among sectors and industries. The greater the level of dispersion, the more opportunity there is for active managers to display their skill in sector or industry rotation. Exhibit 1 shows that dispersion among S&P 500 sectors more than tripled in March 2020. We see similar trends for dispersion among mid- and small-cap sectors.

At a more granular level, we observe in Exhibit 2 that dispersion among S&P Select Industries skyrocketed in March, offering immense opportunities for active managers to display skill in tactically rotating among industries.

We can further understand the importance of sectors by decomposing total market dispersion into within-sector and cross-sector effects. Exhibit 3 demonstrates that the contribution of cross-sector effects to total S&P 500 dispersion more than doubled in March 2020, rising above its long-term average, implying that the rewards for skillful sector picks are increasing.

While active managers now have more potential to add value through sector and industry rotation, we caution that greater opportunity for outperformance does not equal actual outperformance. There is also greater opportunity for underperformance. Skill and luck will determine whether active managers achieve glory or embarrassment.

The posts on this blog are opinions, not advice. Please read our Disclaimers.

Tracking The Cost of Retirement Income

Contributor Image
Hamish Preston

Head of U.S. Equities

S&P Dow Jones Indices

One of the main risks for retirees is not having enough inflation-adjusted income in retirement to support their desired standard of living.  The S&P STRIDE (S&P Shift to Retirement Income and Decumulation)  Indices attempt to solve this problem by focusing explicitly on reducing the volatility of  income rather than reducing the volatility of returns.

In order to help market participants track the cost of a stream of inflation-adjusted retirement income, we recently published our first Cost of Retirement Income dashboard.  (You can sign up for future editions here.)  The dashboard uses the same cost of retirement income measure as our STRIDE indices: the present value of an inflation-adjusted stream of cash flows equal to $1 per year, starting at various retirement dates (vintages) and ending 25 years later.

Exhibit 1 shows that the cost of retirement income increased for all but two S&P STRIDE vintages in the last three months.  For example, the cost of 25 years of retirement income beginning in January 2025 increased from $23.05 to $24.54 in Q1 2020.  Significant market drawdowns in Q1 2020, coupled with declines in U.S. Treasury yields, presented severe challenges for market participants looking to secure a desired level of inflation-adjusted retirement income.  Pre-retirees were particularly impacted given the greater sensitivity of longer-dated vintages to real interest rates, which declined as the U.S. Federal Reserve cut its policy rate in response to the spread of COVID-19.

The dashboard also tracks the hypothetical distributions from post-retirement vintages of the S&P STRIDE indices (see Exhibit 2).  For example, the annualized proportion of last month’s hypothetical distributions – in terms of decumulation points – to the index’s beginning value was 3.26%.  Notably, the decumulation rate is higher than the S&P 500’s 2.34% indicated dividend yield.

Finally, the dashboard reminds us that not all retirement strategies have an explicit focus on providing inflation-adjusted retirement income.  Exhibit 3 shows that nearer-dated S&P STRIDE indices had significantly higher allocations to Treasury Inflation-Protected Securities (TIPS) than the consensus asset mix embodied in the S&P Target Date Indices.  For example, the S&P STRIDE 2020 index’s TIPS allocation (77.2%) was 14 times higher than the S&P Target Date 2020 index (5.5%) at the end of March 2020.  This is a result of the S&P STRIDE indices’ focus on income rather than return volatility, and it impacts asset allocations across the traditional glidepath approach.

For more information, please see the S&P STRIDE Index Series Methodology and the S&P STRIDE Supplemental Data Guide.

The posts on this blog are opinions, not advice. Please read our Disclaimers.

Golden Eye of the Storm

Contributor Image
Fiona Boal

Managing Director, Global Head of Equities

S&P Dow Jones Indices

Much has been made of the relative performance of gold since the start of the global COVID-19 pandemic. The S&P GSCI Gold gained 10.2% YTD through April 7, 2020, highlighting its safe-haven status; however, it is worth reviewing this performance and considering what demand drivers may influence gold prices over the coming months.

The generally held belief is that gold is negatively correlated to equities during extended bear markets, but it is not unusual for gold, and other putative safe havens, to retreat in unison on big down days in the broader market. Gold’s high liquidity makes it an attractive component of a portfolio to sell in times of urgent need for cash, such as when meeting margin calls. This is what occurred in March 2020. The spike in volatility would also have forced investors to cut the overall size of risk-adjusted positions.

It is worth remembering that gold had already enjoyed a surge in investor interest prior to the current crisis, on the back of low to negative interest rates across the globe and a myriad of geopolitical flare-ups.

As for the demand side of the equation, there is plenty of uncertainty in the near term. Jewelry demand, which accounted for approximately 50% of all demand for gold in 2019, has undoubtedly fallen since the start of the year, but it is too early to say by how much. The World Gold Council estimated that Chinese consumer demand fell 30%-50% year-over-year in Q1 2020. Many also expect that jewelry demand in the West will not perform as strongly in the current economic climate.

Central bank buying is even more uncertain, with oil-rich nations negotiating the impact of a collapse in energy prices, and other global sovereigns looking to fund large stimulus packages to mitigate the impact of the current economic downturn.

Investor demand for gold is expected to remain strong, although from a portfolio construction and diversification standpoint, there will be a point at which large investors choose not to add to their gold holdings. The massive fiscal and monetary response by governments to manage, and hopefully lessen, the financial impact of the pandemic has triggered inflationary concerns among some investors. As a hedge against inflation, gold is still viewed by many market participants as the “currency of last resort.”

The supply-side implications should not be ignored. Disruptions to the flow of physical gold between London and New York has already caused some disturbances to the usually stable differential between London Spot and COMEX futures price and led to the launch of a new futures contract that allows for the delivery of a wider choice of gold bars. There has also been a notable disruption to mine supplies that will flow through to the market.

S&P Dow Jones Indices offers a variety of gold-related indices, including the S&P GSCI Gold, S&P WCI Gold, S&P Commodity Producers Gold Index, and S&P GSCI Gold Dynamic Roll 70/30 Futures/Equity Blend (USD).

The posts on this blog are opinions, not advice. Please read our Disclaimers.