Get Indexology® Blog updates via email.

In This List

The Virtue of Protection

The S&P Eurozone Paris-Aligned Climate Index Concept: Implementing the Proposed EU Climate Benchmark Regulation

Cushioning the Decline

Oil Prices Plunge in Response to the Collapse of the OPEC+ Alliance

S&P Dow Jones Indices Launches First Single-Commodity Carbon Emission Allowances Index

The Virtue of Protection

Contributor Image
Fei Mei Chan

Former Director, Core Product Management

S&P Dow Jones Indices

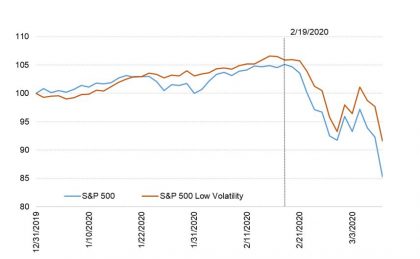
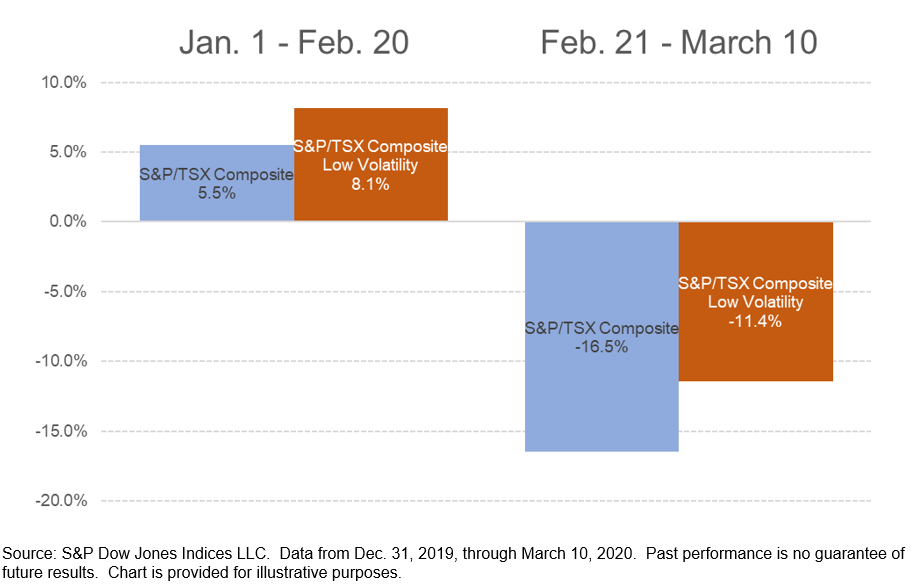
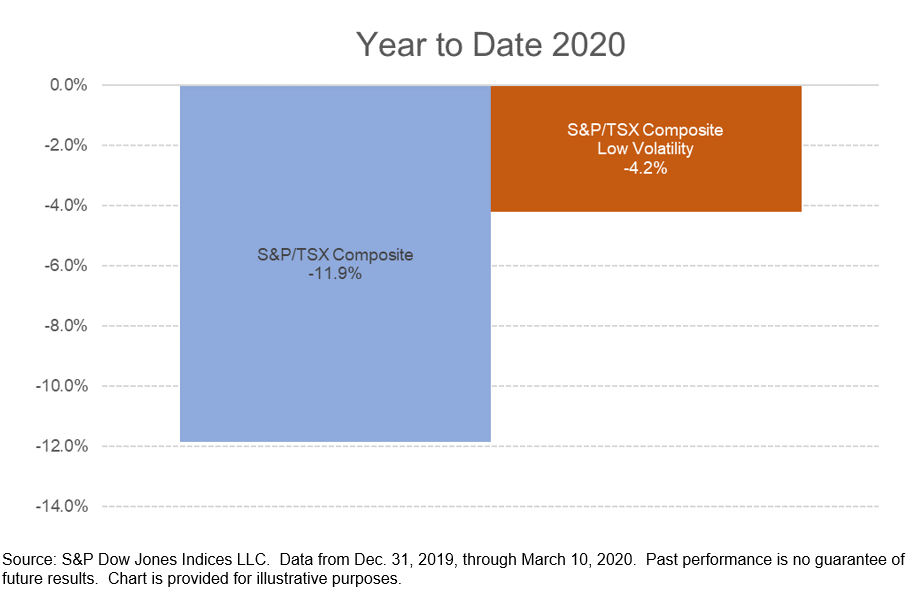
It remains to be seen what the full economic impact of the COVID-19 virus will be, but it is already clear that no equity market  has escaped unscathed.  (In fact, most of them have been scathed rather badly.) The Canadian equity market was humming along in 2020 through February 20, 2020, with the S&P/TSX Composite climbing 5.5% in almost two months. Since then, things have taken a decided turn for the worse, as the index dived 16.5%. Overall, the index is down 11.9% year to date through March 10.

It’s not surprising to see that the S&P/TSX Composite Low Volatility Index has managed to weather the stormy environment well. That’s what it was designed to do, by offering a shield in the bad times while still participating in the good times. Low Vol will typically go up less when the market is rising and go down less when the market is falling.

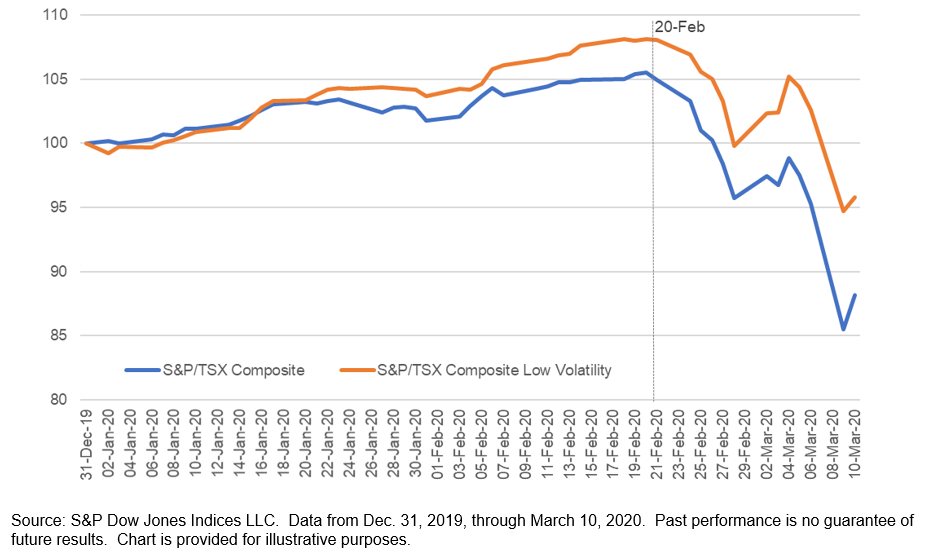
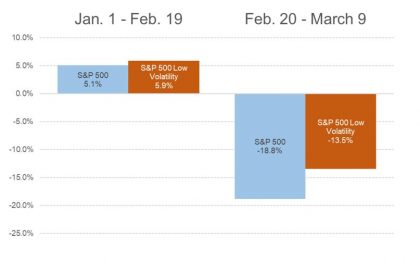
Since the February 20th peak, the low volatility index fell 11.4% compared to the 16.5% decline of the TSX Composite. This is expected; Low Vol should decline less than the market. But it also uncharacteristically outperformed when the market was doing well, up 8.1% compared to 5.5% for the parent index. This allowed Low Vol to gain an extra cushion for its performance year to date, outperforming the S&P/TSX Composite by an impressive 7.6% (S&P/TSX Composite: -11.9%, S&P/TSX Composite Low Volatility: -4.2%). This phenomenon isn’t limited to the Canadian market, the strategy offered a similar protection in U.S. equity markets as well.


The posts on this blog are opinions, not advice. Please read our Disclaimers.

The S&P Eurozone Paris-Aligned Climate Index Concept: Implementing the Proposed EU Climate Benchmark Regulation

Contributor Image
Ben Leale-Green

Former Associate Director, Research & Design, ESG Indices

S&P Dow Jones Indices

Introduction

In January 2020, S&P Dow Jones Indices (S&P DJI) released a paper for the S&P Eurozone Paris-Aligned Climate Index Concept (PAC Concept).  The PAC Concept conceptualizes the proposals of the EU Technical Expert Group on Sustainable Finance (TEG), as published in its Final Report on Climate Benchmarks and Benchmarks’ ESG Disclosure dated September 2019,[1] for the Paris-aligned benchmark and incorporates transition risk, physical risk, and climate opportunities, as laid out by the TCFD[2] (see Exhibit 1).  The PAC Concept implements innovative and forward-looking Trucost[3] datasets: physical risk and the transition pathway approach.  This blog outlines two methods, which the PAC Concept applies to meet the TEG’s proposals.

7% Year-on-Year Decarbonization

To align with the TEG’s proposals for the Paris-aligned benchmark, a 50% carbon footprint reduction and decarbonization[4] by 7% year-on-year are required. Complexity lies in the 7% year-on-year decarbonization: this must occur not only at rebalance but also when calculated using average weights over the period. Consequently, as weights drift between rebalances, the carbon footprint must stay below the 7% year-on-year trajectory on average. Therefore, the PAC Concept’s trajectory targets 5% below the required level of decarbonization and is rebalanced quarterly.  This allows for intra-rebalance weight fluctuations, while remaining compliant.

The middle line in Exhibit 2 shows the required 7% year-on-year decarbonization, the yellow line represents the carbon intensity of the parent index, and the bottom line the PAC Concept’s carbon intensity, measured using average weights.[5] Over the period, the parent index’s carbon intensity decreases then increases—a good methodology test for the PAC Concept.  The PAC Concept’s carbon intensity starts to increase toward the trajectory line; however, at rebalance the index’s decarbonization buffer[6] forces it below required carbon intensity.

Exclusions

The TEG’s proposals also require certain exclusions. These exclusions are based on:

  • Controversial weapons;
  • Societal norms (which the PAC Concept tackles through the use of UN Global Compact exclusions);
  • Severe controversies surrounding environmental issues (the PAC Concept excludes severe controversies in all areas of ESG);
  • Coal exposure;
  • Oil exposure;
  • Natural gas exposure; and
  • Highly intensive electricity generation.

Exhibit 3 outlines the exclusions that have been implemented.

Please refer to the PAC concept paper for further details.

[1]   The EU Technical Expert Group on Sustainable Finance Final Report on Climate Benchmarks and Benchmarks’ ESG Disclosure, September 2019. The final report will serve as the basis for the European Commission for the drafting of the delegated acts under Regulation 2019/2089.

[2]   TCFD. (2017). Final Report: Recommendations of the Taskforce on Climate Related Financial Disclosures.

[3]   A part of S&P Global.

[4]   Decarbonization refers to the reduction of an index’s carbon footprint.

[5]   As advised by the TEG.

[6]   The buffer is referring to targeting below the 7% year-on-year trajectory line.

The posts on this blog are opinions, not advice. Please read our Disclaimers.

Cushioning the Decline

Contributor Image
Craig Lazzara

Former Managing Director, Index Investment Strategy

S&P Dow Jones Indices

With the S&P 500 down -14.7% for calendar 2020, and -18.8% since its peak in late February, investors are rightly concerned to identify strategies that might help to mitigate the ongoing decline.  A number of defensive factor indices have performed relatively well in March, but the leader for the year so far is S&P 500 Low Volatility.

Aficionados of our low volatility index family are probably tired of hearing me say that these indices are designed to deliver participation and protection.  They aim to participate in rising markets, and to protect investors in falling markets, with the important caveat that neither participation nor protection are perfect.  A low vol strategy should be expected to lag the total return of a strong market, although still delivering a positive result.  In falling markets, low volatility may well show a negative total return, although it should normally outperform the benchmark index from which its constituents are drawn.  The market’s action in 2020 provides a window on both participation and protection.

There have been two market regimes so far in 2020: a rising market between the turn of the year and the S&P 500’s peak on February 19, and a falling market between then and (as of this writing) March 9.  The chart below illustrates returns for both the S&P 500 and S&P 500 Low Volatility since the turn of the year.

Exhibit 1
Source: S&P Dow Jones Indices. Data from Dec. 31, 2019 through March 9, 2020. Charts are provided for illustrative purposes. Past performance is no guarantee of future results.

The relative performance picture become clearer when we separate the year’s two regimes, as shown below.  Low Volatility outperformed both when the market rose and during its retrenchment.  The former period is the more remarkable since we typically expect Low Vol to underperform a rising market.  Part of the explanation comes from the strong performance of the Utilities and Real Estate sectors, which are the two biggest overweights in the Low Vol portfolio.

Source: S&P Dow Jones Indices. Data from Dec. 31, 2019 through March 9, 2020. Charts are provided for illustrative purposes. Past performance is no guarantee of future results.

The exact course of future market moves is of course unknowable.  One of the strongest arguments for low volatility strategies is that, by cushioning the pain of market pullbacks, they make it easier for investors to maintain their long-term equity positions.

The posts on this blog are opinions, not advice. Please read our Disclaimers.

Oil Prices Plunge in Response to the Collapse of the OPEC+ Alliance

Contributor Image
Fiona Boal

Managing Director, Global Head of Equities

S&P Dow Jones Indices

The S&P GSCI Brent Crude Oil has fallen by more than 30% over the first six trading days of March. On Friday, March 6, 2020, Russia opted out of a Saudi-led proposal to extend and deepen crude production cuts that had been central to a nearly three-year OPEC+ agreement to manage global oil supplies. With coronavirus cramping global oil demand, OPEC, led by Saudi Arabia, had wanted to further restrict supply to hold up oil prices.

Oil prices lost as much as a third of their value on Monday, March 9, 2020, the largest daily rout since the 1991 Gulf War. The S&P GSCI Brent Crude Oil ended the day down 23.5%. Exhibit 1 offers a visual representation of the this one-day price fall in the Brent crude oil prices.

The disintegration of the OPEC+ agreement almost immediately creates a new operating environment for the world’s three largest oil producers.

  1. Over the weekend, Saudi Arabia slashed the price of its crude oil by USD 6-USD 8 per barrel for all oil grades to all destinations, the largest single price cut in 30 years. It also signaled its intention to raise its oil production next month. While Saudi Arabia has the lowest cost of production, the largest amount of excess oil capacity, and can weather lower oil prices better than others, its economy and its social cohesion are highly dependent on strong oil prices.
  2. It would appear that Russia could no longer stomach that the OPEC+ production cuts were unintentionally favoring U.S. shale producers and likely limiting domestic energy investments. The Russian economy is more diversified than that of Saudi Arabia, and it is possible that Russia could also weather lower oil prices for some time.
  3. U.S. shale producers are the clear losers if this new low-price environment becomes the norm. Lower oil prices will quickly lead to acute financial stress and declining production from U.S. shale producers and other high-cost producers. U.S. crude oil exports could fall significantly.

It is also worth highlighting that the collapse of the OPEC+ agreement, and the anticipated increase in supply that it will bring, has been made against the backdrop of stymied global oil demand. While lower oil prices typically boost consumption, the global coronavirus outbreak is quashing oil demand and amplifying the effect of the anticipated supply surge. Falling demand has the potential to both deepen and lengthen the energy price rout. The most recent forecast from the International Energy Agency now has global oil demand contracting in 2020, which would mark the first year-over-year fall in demand in more than a decade.

Unless Saudi Arabia’s shock and awe tactics bring OPEC+ members, namely Russia, back to the negotiating table, the fight for oil market share has well and truly commenced.


The posts on this blog are opinions, not advice. Please read our Disclaimers.

S&P Dow Jones Indices Launches First Single-Commodity Carbon Emission Allowances Index

Contributor Image
Fiona Boal

Managing Director, Global Head of Equities

S&P Dow Jones Indices

The S&P GSCI Carbon Emission Allowances (EUA) EUR represents an expansion of the single-commodity series of indices based on the S&P GSCI and is the first index of its kind in the market. The S&P GSCI Carbon Emission Allowances (EUA) EUR is designed to provide investors with a reliable and publicly available investment performance benchmark for European Carbon Emission Allowances. The S&P GSCI Carbon Emission Allowances (EUA) EUR is based on the ICE EUA Futures Contract.[1]

Carbon emissions trading is a market-based method for reducing global greenhouse gases. Carbon trading in the EU was implemented as a result of the Kyoto Protocol—created by the United Nations Framework Convention on Climate Change (UNFCCC), aimed at fighting global warming. The objective was to develop a market that manages worldwide greenhouse gas emissions based on economic and trading principles that are common across commodities markets. This approach allows countries to reduce pollution with a cap and trade system that operates through regulated markets.

Emissions trading markets have become increasingly robust over recent years, offering a market-based approach to limiting pollution by providing economic incentives for achieving reductions in pollutant emissions. A liquid, transparent market for carbon and a robust price for carbon are critical to facilitating the reduction of greenhouse gas emissions. The S&P GSCI Carbon Emission Allowances (EUA) EUR seeks to offer access to the return stream of a unique asset that is uncorrelated to major commodities and other asset classes and, at the same time, may promote a transition to a lower carbon economy.

Investors may choose to utilize the carbon emissions trading market to express specific views on the price of carbon, to hedge or offset more carbon-heavy investments in their portfolio or combine carbon emissions with other assets to create energy-transition or low-carbon strategies.

There may also be opportunities for participants in the physical carbon emissions market to utilize financial products based on the S&P GSCI Carbon Emission Allowances (EUA) EUR in conjunction with other risk management instruments. Broadening the number of financial instruments available to hedgers in the global carbon market is an important goal of the S&P GSCI Carbon Emission Allowances (EUA) EUR.

[1] https://www.theice.com/products/197/EUA-Futures

The posts on this blog are opinions, not advice. Please read our Disclaimers.