Get Indexology® Blog updates via email.

In This List

S&P Composite 1500®: SPIVA

The Quality Factor Beat the S&P 500 in 2019

S&P China 500 Ignores Trade Tensions to End the Year on a High Note

U.S.-Iran Conflict – Financial Markets Appear to Look Past Another Geopolitical Risk

The Active vs. Passive Debate

S&P Composite 1500®: SPIVA

Contributor Image
Fei Mei Chan

Former Director, Core Product Management

S&P Dow Jones Indices

While the iconic S&P 500® is one of the world’s best known benchmarks, the S&P Composite 1500 (comprising the S&P 500, S&P MidCap 400®, and S&P SmallCap 600®) covers a broader spectrum of the capitalization of the U.S. equity market. Though the S&P 500 is often used as a measuring stick for large-cap fund performance (and rightly so), the S&P Composite 1500 can be a more appropriate benchmark for funds that are not limited to large-cap stocks.

The performance differences between the S&P 500 and the S&P Composite 1500 are not large, never fluctuating outside a 150 basis point annual spread from 2001 through 2018. The tight tracking is expected; the S&P Composite 1500 is also a market cap based index and as such, the S&P 500 would be the predominant sub index, typically accounting for more than 85% of the S&P Composite 1500. But almost without fail, the direction of the spreads of the S&P Composite 1500 are in sync with those of the S&P SmallCap 600 when measured against the S&P 500. When small caps outperform, the S&P Composite 1500 typically beats the S&P 500, and vice versa.

Our SPIVA scorecards measure the performance of active funds against an appropriate passive benchmark. The S&P Composite 1500’s wider capitalization range makes it an appropriate benchmark for multi cap funds as well as all general domestic funds. In both cases, fund managers underperformed the S&P Composite 1500 in 12 of the 18 years observed—and things have looked particularly bleak in each of the last five years. While 2019 results are not available yet, based on market dynamics, we’d expect the average active manager to underperform again.


The posts on this blog are opinions, not advice. Please read our Disclaimers.

The Quality Factor Beat the S&P 500 in 2019

Contributor Image
Aye Soe

Former Managing Director, Global Head of Core and Multi-Asset Product Management

S&P Dow Jones Indices

In 2019, U.S. equities posted double digit gains, with the S&P 500® returning 31.49%—its best year since 2013 and second-best in a decade. This continued strong performance highlights the potential difficulty of beating the S&P 500.[1] The question then arises: what strategy (if any) outperformed the S&P 500 in 2019?

Our latest S&P 500 Factor Indices Dashboard details the performance of various passive factor strategies across multiple time horizons. Five factor-based strategies outperformed the S&P 500 in 2019—high beta, quality, buyback, minimum volatility, and value (see Exhibit 1).

We focus on quality—the second-best-performing factor—in this blog. High beta, by definition, tends to deliver higher returns than the broad market in a bullish environment. Because of this, its standing as the best-performing factor in 2019 comes as no surprise. Quality, on the other hand, is a frequently debated factor for which definitions can vary greatly and performance can be cyclical.[2] Therefore, its outperformance in 2019 merits additional insight and analysis.

S&P DJI’s definition of high-quality companies is consistent with Graham and Dodd’s definition of “sustainable earnings power.”[3] We measure quality as a composite score of profitability (ROE), low earnings accruals, and prudent usage of leverage (debt/equity). Back-testing, as well as live performance data, show that over a long-term investment horizon, higher-quality companies in the S&P 500 outperformed lower-quality companies and the broad market on both an absolute and risk-adjusted return basis.[4]

Given that the S&P 500 High Quality Index comprises three fundamental ratios, we sought to understand which ratio contributed the most to the index returns. Exhibit 2 shows the performance of each of the underlying ratios—ROE, accruals, and debt-to-equity—in 2019.

The market rewarded profitable companies handsomely in 2019. ROE was the best-performing ratio of the three (38.2%), followed by accruals (29.8%), and then leverage (28.1%). In fact, the portfolio of the highest ROE companies outperformed the S&P 500 by nearly 670 bps.

Given quality’s performance against the S&P 500 in 2019, we wanted to dig deeper into multi-factor strategies that incorporate elements of quality in their index construction. For instance, the S&P 500 GARP Index—which combines growth, value, and quality scores to arrive at a portfolio of 75 growth securities with relatively high earnings quality and reasonable valuations—kept pace with the S&P 500 in 2019, returning 31.5%. On the other hand, the S&P 500 Quality, Value & Momentum Multi-Factor Index lagged the S&P 500 and returned 26.2%. The index’s underperformance is partly driven by exposure to the momentum factor (26.25%), which returned less than the broad market in 2019.

In sum, 2019 was a strong year for domestic equities. The S&P 500, a market barometer for large-cap U.S. equities, posted its second-best year in a decade. Quality was one of the few factors that managed to deliver higher returns than the S&P 500. Upon deeper examination, we found that profitability was the biggest return contributor to the quality factor, posting significantly higher returns than the S&P 500. While it may seem like 2019 was a difficult period to beat the S&P 500, our blog highlights that passive factor strategies with exposure to quality performed even better than the S&P 500 in 2019.

[1]   Chris Bennett, “https://www.indexologyblog.com/2020/01/07/from-hard-to-beat-to-nigh-on-impossible/

[2]   Aye Soe, “https://www.indexologyblog.com/2018/05/23/quality-part-i-defining-the-quality-factor/

[3]   Daniel Ung, Priscilla Luk, and Xiaowei Kang. “Quality: A Practitioner’s Guide?”. S&P Dow Jones Indices.

[4]   ibid.

The posts on this blog are opinions, not advice. Please read our Disclaimers.

S&P China 500 Ignores Trade Tensions to End the Year on a High Note

Contributor Image
John Welling

Director, Global Equity Indices

S&P Dow Jones Indices

The S&P China 500 advanced 12.9% in Q4 2019, an indication that investors shrugged off U.S.-China trade tensions and signs of a slowing economy. The performance was a reversal from losses during the prior two quarters, which had followed an outstanding 23.6% surge in Q1 2019. The full-year result was a welcome contrast to the dismal end to 2018, when trade concerns appear to have peaked.

Chinese stocks generally outpaced emerging and developed equity benchmarks during Q4 2019, as the S&P Emerging BMI gained 11.1% and the S&P Developed ex-U.S. BMI stood at 9.3%. Tallied against the full array of global indices on an annual basis, only the U.S.-based S&P 500® managed to beat the Chinese benchmark in 2019 (and only by a slim margin; see Exhibit 1).

Onshore China Stocks Lead in 2019

Broadly speaking, onshore-listed China A-shares gained an advantage over offshore stocks throughout 2019; the S&P Access China A gained 34.7% while the S&P China Broad BMI, which includes A-shares at a limited weight, gained a lesser 22.0%. As expected, the S&P China 500 posted performance in the middle of most major China equity benchmarks, given its diversified composition across all Chinese share classes and sectors.

Consumer Staples and Information Technology Led Sectors in Annual Gains; Energy Lagged

All 11 sectors performed positively during Q4 2019, while 10 of these logged YTD gains. Consumer Staples—led by Kweichou Moutai (up 97.6% YTD)—and Information Technology were sector leaders for the year, with gains of 70.5% and 55.4%, respectively. Energy was the sole sector to miss YTD gains, concluding 2019 with a 6.9% loss.

Financials and Consumer Discretionary (pushed higher by Alibaba, up 54.7% YTD)—the two largest sectors of the S&P China 500 by weight—contributed the most to positive performance in 2019. Combined with Communication Services, the next largest, these sectors represented over half of the index’s annual gains, highlighting the knock-on effects of an increasingly robust consumer-based economy.

Substantial Price Appreciation Raises Valuation Metrics

The S&P China 500 trailing P/E moved higher in Q4 to 15.4x, surpassing the 10-year average P/E ratio of 14.0x, as well as rolling 1-, 3-, and 5-year figures, driven largely by substantial price appreciation. Meanwhile, the index’s forward P/E advanced somewhat less drastically from 12.4x in the prior quarter to 13.8x in Q4 2019, reflecting positive increases in earnings expectations.

Despite the recent increase in index valuations, metrics of broader emerging market indices were well within range, as the S&P Emerging BMI trailing P/E stood at 16.6x at the end of Q4 2019. The S&P China 500 dividend yield, meanwhile, decreased from 2.20% to 2.01% on a quarterly basis.

The posts on this blog are opinions, not advice. Please read our Disclaimers.

U.S.-Iran Conflict – Financial Markets Appear to Look Past Another Geopolitical Risk

Contributor Image
Fiona Boal

Managing Director, Global Head of Equities

S&P Dow Jones Indices

The financial market’s reaction to the escalation of tensions between the U.S. and Iran have so far been muted, even benign (see Exhibit 1). A little over a week from the U.S. killing of top Iranian commander Qassem Soleimani and Iran’s response (missile attacks on U.S. army bases in Iraq), and a casual observer of financial markets would be hard pressed to see what all the fuss is about.

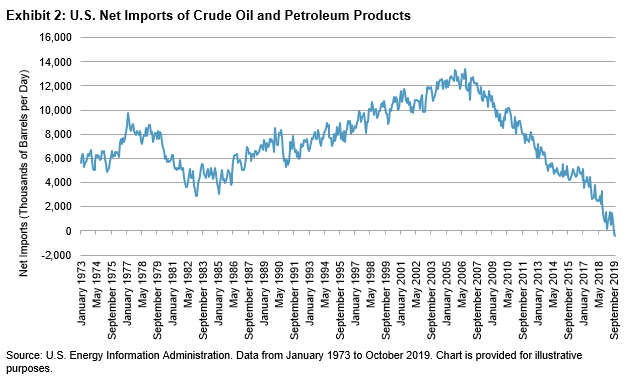
Taking market performance as a measure, there has been little visible dent to investors’ confidence from the most recent geopolitical flare up. Have market participants, irrespective of asset class, grown complacent to geopolitical risks, or have they decided that the overall threat to the global economy of further incremental deterioration in U.S.-Iranian relations and more broadly, Middle Eastern stability, is relatively contained?

From the perspective of the oil market, there has been a major structural change to the market that may offer an explanation. In the past, oil prices were the main transmission mechanism from major Gulf conflicts to the broader global economy and financial markets. However, the U.S. is now a net exporter of petroleum products, which was not the case during either the first or second Gulf War. The U.S. has essentially achieved energy independence and it can now use its own supplies to offset the impact of Middle Eastern supply shocks. It appears that oil market participants would need to see sustained physical market disruption to justify adding a significant risk premia to energy prices.

There are likely other factors at play; not least of all, the fact that investors who have looked past a myriad of geopolitical events over recent years, including the U.S.-China trade war, North Korean missile tests, conflict between Russia and Ukraine, and the ongoing conflict in the Middle East, have been rewarded with strong equity market performance.

The posts on this blog are opinions, not advice. Please read our Disclaimers.

The Active vs. Passive Debate

Contributor Image
Maria Sanchez

Director, Sustainability Indices Product Management, Latin America

S&P Dow Jones Indices

The debate between active management and passive management has being ongoing for several years. Active managers make investment decisions in an effort to outperform their benchmark, while passive managers simply track an index to gain exposure to a market or segment of a market. Active managers claim to have enough skills to consistently outperform the market, but do they really beat their benchmarks?

SPIVA®, which stands for S&P Indices versus Active, reports on the performance of actively managed funds against their respective category benchmarks, such as the S&P 500® in the U.S. and the S&P/BMV IPC here in Mexico. The results are impressive and consistent across the world: indices tend to outperform the majority of actively managed funds, mainly over the over the mid- to long-term investment horizons.

The SPIVA Latin America Mid-Year 2019 Scorecard showed that over the one-year period ending on June 30, 2019, 64% of actively managed funds in Mexico underperformed the S&P/BMV IRT, the total return version of the flagship S&P/BMV IPC. In addition, the percentage of active funds underperforming the benchmark increased over longer-term investment horizons; 82%, 90%, and 86% of active managers were not able to beat their benchmark over the 3-, 5-, and 10-year horizons, respectively. One should notice that active fund managers do not always lag the benchmarks, especially over the short-term horizons. A clear example was in the year-end 2018 report, when more than 58% of Mexican active funds outperformed the S&P/BMV IRT. The numbers suggest that active managers’ outperformance relative to the benchmark may exist, but rarely.

Furthermore, it is challenging for managers to consistently remain at the top of their categories, especially over longer horizons. The Latin America Persistence Scorecard demonstrates that top-performing active funds have little chance of repeating that success in subsequent years.

The SPIVA report does not intend to explain why underperformance exists, rather it is meant to act as a scorekeeper. That said, we could argue that many active managers do not have the skill to beat their benchmarks consistently that they may claim to have. It is difficult to time the market with consistent success, and the trading costs associated with excessive trading from active managers does not help fund performance. Furthermore, SPIVA uses net-of-fees returns of active funds, and numerous studies[1] show that the fee drag in fund returns can be substantial.

SPIVA can help investors make informed decisions about whether to use an active manager or invest in an index-based fund such as an ETF. It also reminds investors that using past performance as the main guidance in fund selection could be misleading due to the lack of performance persistence among actively managed equity funds.

This article was first published in Fortune Mexico Magazine December 2019.

[1] Sharpe, William F., “The Arithmetic of Active Management,” Financial Analysts Journal, January/February 1991, Volume 47 Issue 1. “Properly measured, the average actively managed dollar must underperform the average passively managed dollar, net of costs.”

The posts on this blog are opinions, not advice. Please read our Disclaimers.