Get Indexology® Blog updates via email.

In This List

From “Hard to Beat” to Nigh-On Impossible

Strongest Annual Performance for the S&P GSCI Since 2007

The Rising Importance of Dividends When Earnings Slow

Emerging Markets: Enter the Dragon

The Effects of Dispersion in Carbon Intensity Scores on Carbon-Efficient Portfolio Construction

From “Hard to Beat” to Nigh-On Impossible

Contributor Image
Chris Bennett

Former Director, Index Investment Strategy

S&P Dow Jones Indices

Our SPIVA® reports have shown, year after year, that market-cap weighted benchmarks are, to put it kindly, hard to beat.  However, in 2019 a range of circumstances made “hard to beat” become nigh-on impossible for the S&P 500®.

In general, there are three common ways by which an active portfolio can outperform its benchmark: over or under-weighting benchmark stocks, by tilting towards factors or sectors, or by venturing beyond the benchmark’s constituents to hold anything from cash to commodities.  Each of these options was uncommonly disadvantaged last year.

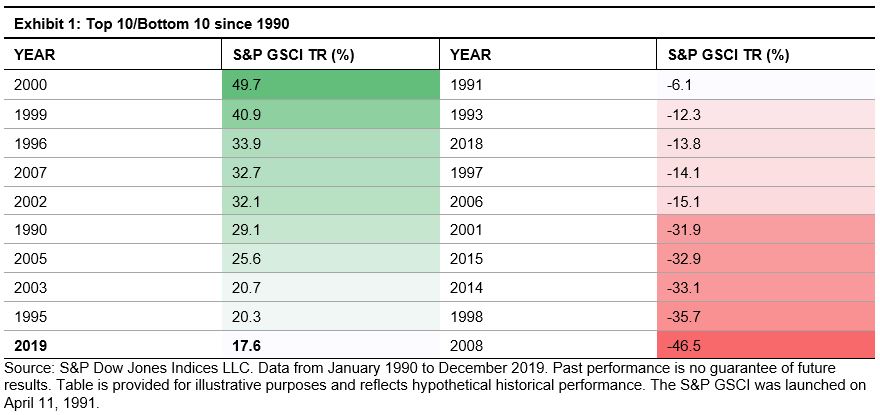
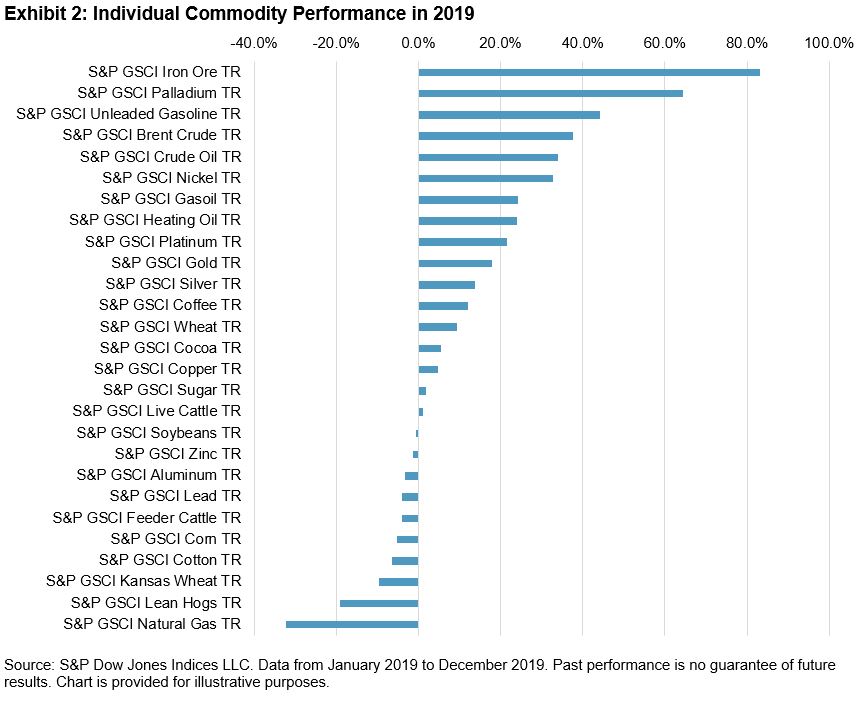
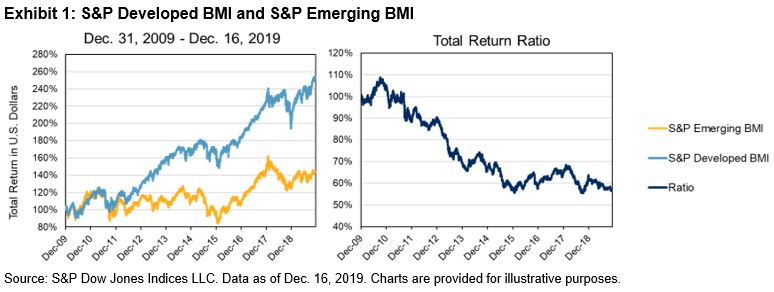
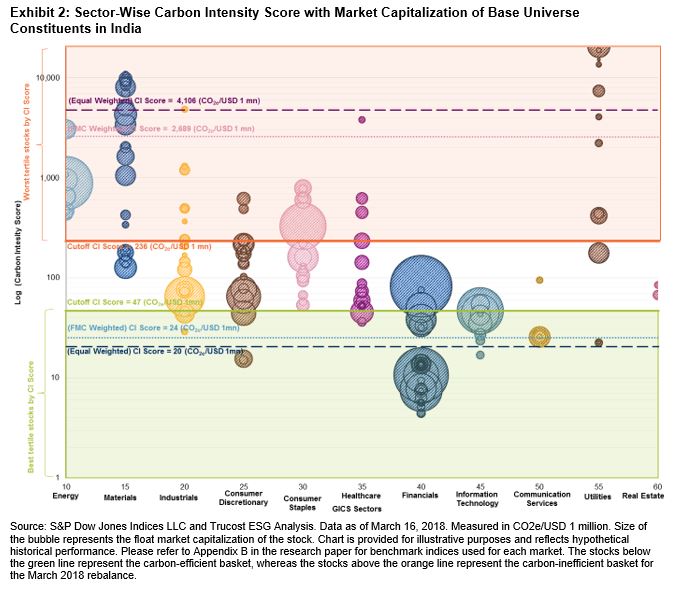
Based on the performance of a wide range of alternative markets, going outside the benchmark was not much help.  Smaller U.S. stocks, international equities, fixed income, and commodities all underperformed large-cap U.S. equities.

Stock selection within the benchmark was handicapped by the 51% average gain of the biggest five stocks in the S&P 500.  Since few active managers (and few factor indices) allocate as much to the largest companies as the benchmark does, when the very largest stocks outperform, stock selection becomes harder.

Relatedly, the larger sectors of the S&P 500 also outperformed their smaller peers.  The Information Technology sector – the largest in the S&P 500 – gained a whopping 50% on the year.

The performance of equal-weight indices provides an easy way to analyse the importance of size in stock and sector selection.  S&P 500 Equal Weight Index has the same constituents as the S&P 500, but weights each constituent equally, with the result that the sector allocations are also more balanced.  As illustrated in the latest S&P Equal Weight Sectors Dashboard, both underweighting the largest sectors and weighting equally within each sector helped to contribute to the 2.3% underperformance of the S&P 500 Equal Weight index in 2019.  In fact, sector allocations were responsible for the lion’s share of underperformance – with an underweight in the tech sector accounting for over 1% of the drag.

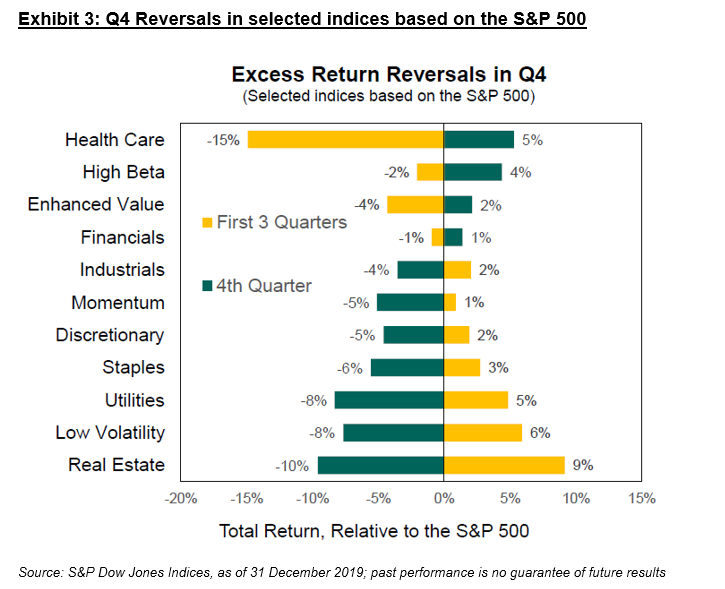
But …  some parts of the market must have outperformed?  If you didn’t overweight the largest sectors and stocks, the sting in the tail of the market’s performance this year was that, beyond portfolio construction, a degree of timing was also required to maintain outperformance.  As we highlighted in our year end S&P 500 Factor Dashboard , for several areas of the market, there were major reversals into the year end: the Health Care sector, for example, underperformed the S&P 500 by 15% in the first three quarters, and then outperformed by 5% in Q4.  In September, the S&P 500 Low Volatility Index looked certain to finish the year on top, but failed to keep pace with the fourth quarter’s rally.

What does this mean for active equity managers?  Early indications point to a rough year for stock pickers, with less than 1/3 of active U.S. equity managers estimated to have finished 2019 ahead of their benchmarks.   Whatever else may be true of the coming year, active managers might at least hope that the S&P 500 goes back to being just “hard” to beat.

The posts on this blog are opinions, not advice. Please read our Disclaimers.

Strongest Annual Performance for the S&P GSCI Since 2007

Contributor Image
Fiona Boal

Managing Director, Global Head of Equities

S&P Dow Jones Indices

The S&P GSCI ended 2019 up 17.6%. This was the S&P GSCI’s 10th-strongest performance since 1990 and its best annual return since the heights of the so-called commodity super cycle in 2007. Across the commodity markets, gains were driven by the petroleum complex and precious metals, while agriculture and livestock detracted from headline performance.

Petroleum prices climbed during the year due to sanctions on Iran and Venezuela, as well as continued OPEC+ production cut compliance. The S&P GSCI Crude Oil ended 2019 34.1% higher, but the bulk of the gains came in the first quarter after the U.S. introduced sanctions on Venezuela. As the new decade commences, the oil market will be forced to negotiate swelling supplies, particularly from the U.S., and some indications of weakening global demand. The U.S. is on track to be a net petroleum exporter on an annual basis for the first time in 2020. It was not all positive news for energy commodities this year. Natural gas ended the year with the poorest performance of all the single‑commodity S&P GSCI constituents. The S&P GSCI Natural Gas was down an eye-watering 32.3% for the year.

Gold proved one of the most popular assets for investors in 2019. The S&P GSCI Gold posted its best performance since 2010, gaining 18.0%, driven by safe-haven buying powered by escalating geopolitical tensions, a protracted trade war, and quantitative easing by major central banks. As more government bonds across the globe displayed negative yields throughout 2019, gold remains well positioned as a safe-haven alternative for investors going into the new year. The S&P GSCI Palladium ended the year 64.3% higher, continuing a multi-year price appreciation driven by its use in car exhaust to defuse emissions.

Among the industrial metals, nickel was the standout performer in 2019. While well off its late summer highs, the S&P GSCI Nickel ended 2019 up 32.8%. Supply constraints, in the form of an export ban from Indonesia, dictated price action in the nickel market for the bulk of the year. It would be folly not to mention the stellar performance of the S&P GSCI Iron Ore, which ended the year 83.1% higher, a function of several significant supply curtailments and persistent Chinese steel demand.

The agricultural markets struggled this year under the weight of the protracted U.S.-China trade war and plentiful global supplies. One of the main features of December’s “Phase One” trade deal between the U.S. and China was China’s commitment to purchase a large amount of U.S agricultural goods. There is skepticism that China will be both willing, and able, to purchase such volumes of U.S. commodities and, therefore, if these purchases will be enough to stimulate demand for agricultural commodities in 2020. Wheat was the outlier in the grain complex, with the S&P GSCI Wheat ending the year up 9.4%, a third straight year of gains, on tightening supplies, particularly from Australia, which is in its third year of drought.

Despite African swine fever ravaging the world’s largest pig herd, the S&P GSCI Lean Hogs fell 19.2% in 2019. On top of burgeoning U.S. hog supplies, the U.S.-China trade war greatly restricted the ability of U.S. pork producers to export their product to China.

The posts on this blog are opinions, not advice. Please read our Disclaimers.

The Rising Importance of Dividends When Earnings Slow

Contributor Image
Kieran Kirwan

Director, Investment Strategy

ProShares

Summary

  1. With Q3’s earnings season substantially complete, 2019 earnings for S&P 500 companies are expected to decline on a year-over-year basis.
  2. After several strong quarters last year, the first three quarters this year have seen marked earnings deceleration.
  3. Providing 1/3 of historical S&P 500 total returns, dividends could become important when the market may be near full valuation and corporate earnings are decelerating
  4. Indexes such as the S&P 500 Dividend Aristocrats track companies with long-term track records of continuous dividend growth. As such, funds that follow them may be worth a closer look.

 Third Quarter Earnings on Pace to Decline Again

 Through November 15, 92% of the S&P 500 constituents have announced earnings, and investors have been paying close attention. Most companies that have reported thus far have exceeded estimates, which had in many instances been guided lower. On the surface this is, of course, positive news. But when looking for year-over-year growth, a different story begins to emerge. While 2018 saw three quarters with 20% advances, year-over-year earnings growth in the first two quarters of 2019 decelerated markedly and ended flat to slightly down. As of November 15, the estimated earnings decline for Q3 2019 as compared with the same period in 2018 currently stands at just over 2%. If that turns out to be the case, when all is said and done, it would mark the third consecutive quarterly decline. Soon enough, investors will begin to ask the question of where the earnings are going to come from to support current valuations.

Decelerating Earnings Could Make Dividends More Important

In a market susceptible to fits and starts, investors remain understandably attracted to dividend strategies. Beyond the obvious appeal of a potential income stream during a time of low fixed-income yields, dividends have historically provided a sizeable slice of total-returns pie. In fact, dividends have accounted for roughly one-third of S&P 500 Total Return Index performance going back to 1960.

Interestingly, the contribution of dividends to returns has varied considerably over time. Dividends accounted for more than 72% of returns during the 1970s but less than 16% during the 1990s. So, considering their historical average around 33%, how important will dividends be going forward? A credible argument can be made that dividends are likely to represent an above-average proportion of, and be a significant contributor to, near-term returns.

The rationale behind this argument becomes apparent if we look at the relationship between dividend yield, earnings growth rate, and potential valuation changes from current levels. If: 1) one considers the market to be currently at or very near full valuation; and 2) the recent trend of flat to slightly-down earnings growth continues; then 3) it follows that dividends may indeed represent a greater-than-average portion of total returns going forward.

Dividend Growth Could Hold Even Greater Appeal

Given the potential above-average contribution to returns going forward and general investor appetite for dividends, quality companies that continuously grow their dividends could become even more appealing if earnings continue to decelerate. In particular, investors might want to look into the S&P 500 Dividend Aristocrats—high-quality companies that have not just paid dividends but grown them for at least 25 consecutive years. In fact, the Aristocrats delivered positive, if moderate, earnings growth during the first two quarters of 2019. Over time, companies that have grown their dividends like this generally have had stable earnings and solid fundamentals.

There are several indexes tracking long-term dividend growth companies—the S&P 500® Dividend Aristocrats® Index, the S&P MidCap 400® Dividend Aristocrats® Index, the S&P® Technology Dividend Aristocrats® Index and others—and there are ETFs that follow many of them. So, in a market with decelerating earnings, high-quality dividend growth investments could be worth a closer look.

The posts on this blog are opinions, not advice. Please read our Disclaimers.

Emerging Markets: Enter the Dragon

Contributor Image
Sherifa Issifu

Senior Analyst, U.S. Equity Indices

S&P Dow Jones Indices

The 2010s proved to be a disappointing decade for the S&P Emerging BMI, at least in relative terms. With a few weeks to go until the finish line, the index stands at a total return of 50% in U.S. dollars, compared with 160% for the S&P Developed BMI, as of Dec. 16, 2019. Although emerging markets did show signs of catching up in 2016 and 2017, as Exhibit 1 shows, overall the ratio between the two indices plots a steady underperformance over the past 10 years.

In the early 2000s, the BRICs (an acronym for Brazil, Russia, India, and China) were viewed as the emerging economies to watch over the coming decades. However, only China has consolidated its place as a true heavyweight, with the underperformance of other major developing markets acting as a drag on benchmark returns.

Our broadest measure of the Chinese equity market is the combination of the S&P Total China Domestic BMI (a broad universe of Chinese securities) plus the S&P China A Venture Enterprises Index of smaller Shenzhen-listed firms. Based on these indices, the total capitalization of the Chinese equity market has grown seven-fold since 2006, while the number of listed stocks quadrupled. Exhibit 2 plots the rise in number and capitalization of Chinese equities in the past 13 years.

China is a special case in several respects. While emerging markets are usually dominated by banks, commodity-related firms, and local consumer champions, China’s boom in equities has encompassed a wider and more balanced range of sectors, with the result that (as shown in Exhibit 3) the Chinese market has been less sectorally concentrated than is typical for so-called emerging or frontier markets.

Rather than price appreciation, the significant driver in the growth of China’s equity markets has been introductions of companies to list on the exchanges—particularly in the tech-heavy sectors. Evidencing this remarkable growth, as Exhibit 4 illustrates, today there are more Chinese Information Technology and Communication Services stocks than U.S. ones.

The posts on this blog are opinions, not advice. Please read our Disclaimers.

The Effects of Dispersion in Carbon Intensity Scores on Carbon-Efficient Portfolio Construction

Contributor Image
Akash Jain

Director, Global Research & Design

S&P BSE Indices

In this blog, we investigate the dispersion of carbon intensity scores in detail and its effect on carbon-efficient portfolio construction via equal- and market-cap-weighted approaches. A company’s carbon efficiency is measured by its carbon intensity score (C.I. score), provided by Trucost, which is defined as the greenhouse gas (GHG) emissions from a company’s direct operations and first-tier suppliers, measured in metric tons of carbon dioxide equivalent (CO2e) per USD 1 million of revenue (CO2e/USD 1 million).[1] Some sectors, by nature of business, such as such as Utilities, Materials, Industrials, and Energy are carbon inefficient (higher C.I. scores) while other sectors, such as Financials, Information Technology, and Consumer Discretionary, are more carbon efficient.

C.I. scores can be widely spread even within the same sector. Relative dispersion[2] is a metric that allows us to measure this spread by normalizing across sectors and markets. The relative dispersion seen across the seven markets studied for the March 2018 basket (see Exhibit 1) shows that, in most Asian markets, Materials, Industrials, and Utilities sectors had the highest relative dispersion. For example, Exhibit 2 shows that in the Utilities sector in India, the C.I. scores ranged from 23 to 26,948 CO2e/USD 1 million. Within the Utilities sector, the stock with the lowest C.I. score belonged to a company involved with the generation and sale of renewable energy, whereas the company with the highest C.I. score was involved with the generation of power though coal and gas in addition to solar, wind, and hydroelectricity. This is of particular importance, as it enables a sizeable reduction of the weighted C.I. score even in sector-neutral portfolio construction approach (though to a more modest extent when compared with unconstrained approach, which does not limit active sector exposures). In India, the C.I. scores of the unconstrained and the sector-neutral carbon-efficient portfolios were 24 and 155, respectively. (see Exhibit 3 in our recent research paper).

The wide spread in C.I. score and market capitalization also affected the weighted average C.I. scores of the carbon-efficient and carbon-inefficient tertiles across markets. For example, in India, for the March 2018 basket, the equal-weighted C.I. score for the carbon-inefficient tertile basket was 4,106 CO2e/USD 1 million, whereas the market-cap-weighted version of the C.I. score was 2,689 CO2e/USD 1 million (see Exhibit 2), implying that the large-cap companies in India had lower C.I. scores in the carbon-inefficient basket. Despite dominance by large-cap companies in the market-cap-weighted portfolio, a reduction in the weighted average C.I. score for the carbon-efficient portfolios versus their respective carbon-inefficient portfolios remained significant across all markets. (see Appendix E in our recent research paper).

This unique spread of C.I. scores within each sector in each market could drive investors to prefer constructing a carbon-efficient portfolio either via sector-unconstrained or sector-neutral selection processes. Furthermore, investors could opt to weigh equally, although those concerned with investability could potentially turn to the market-capitalization-weighing approach to portfolio construction in order to improve C.I. scores, and therefore preserve asset size scalability.

[1]   Direct GHG emissions of an automobile manufacturer include the emissions from operation or production (e.g., welding, assembly of parts, painting, etc.), while the first-tier indirect emissions include emissions from supply chains and procurement, such as utilities, steel manufacturing, tires, spare parts, and business travel.

[2]   Relative dispersion = , where  represents the C.I. score of each stock.

The posts on this blog are opinions, not advice. Please read our Disclaimers.