The S&P Composite 1500 measures the U.S. equity market by combining three world-renowned benchmarks – the S&P 500®, S&P MidCap 400®, and S&P SmallCap 600® – which together encompass approximately 90% of U.S. equity market capitalization. With 2019 in the rear-view mirror, it is obvious that last year was extremely positive for U.S. equities: the S&P 1500 recorded its best calendar year total return since 2013, up 30.90%. While this performance may not be surprising given the healthy gains posted by most size, sector, and style segments, it reflects a few broader market trends.

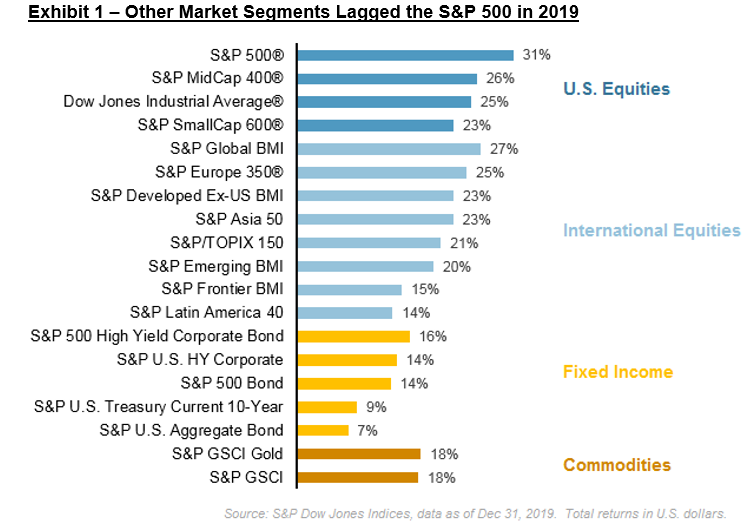
Large-cap stocks have outperformed their mid- and small-cap counterparts in every year since 2016 and this continued through 2019: the S&P 500 (+31.49%) beat the S&P MidCap 400 (+26.20%) and the S&P SmallCap 600 (+22.78%) last year. This continued outperformance meant that the collective weight of S&P 500 constituents in the S&P Composite 1500 – as measured at quarterly intervals between the end of 1994 and 2019 – hit an all-time high of 91% in December 2019. This helps to explain why the S&P Composite 1500 outperformed the mid- and small-cap market segments last year.

At the sectoral level, Information Technology companies have played an increasingly important role in determining market performance. For example, the S&P 1500 Information Technology sector gained an impressive 49.75% last year, 17.5% more than second-placed Communication Services. Combined with it sizeable average weight in the S&P 1500 – over 20% in 2019 – Information Technology accounted for nearly a third of the market’s gains last year.
More broadly, and repackaging an infographic from our daily dashboard (I highly recommend subscribing to ensure you receive witty market commentary direct to your inbox) 2019 was positive for all the S&P 1500 sectors and industries. Not bad when you consider many people’s market outlook at the start of the year!

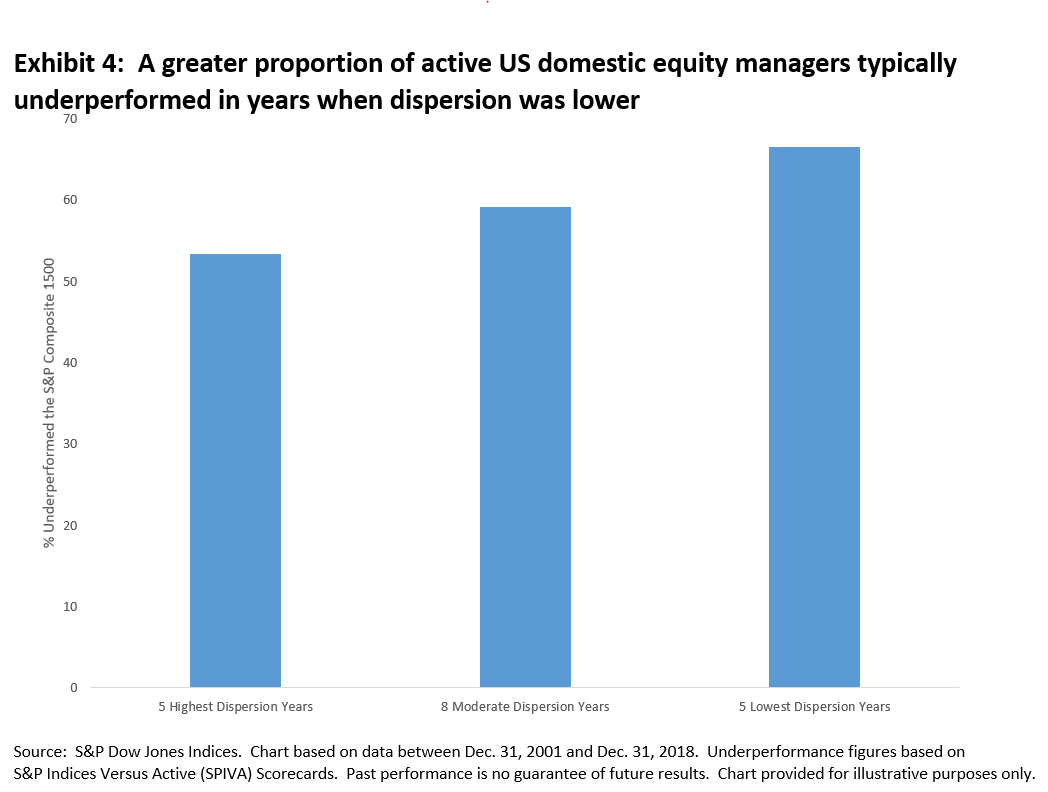
Finally, some have argued that 2020 may be the year of the stock picker based on a recent decline in correlations. However, as we have pointed out repeatedly, dispersion is a better measure of active management’s alpha opportunity: Exhibit 4 highlights that a greater proportion of active domestic U.S. equity managers typically underperformed the S&P 1500 when dispersion was lower.
Given the below-average dispersion in the S&P 1500 last year, most active managers may find it challenging to outperform the U.S. equity market benchmark.
The posts on this blog are opinions, not advice. Please read our Disclaimers.