Get Indexology® Blog updates via email.

In This List

Equity Markets React to the U.K. Election

Volatility Did Not Help Active Managers’ Persistence Scores

2019: A Market Review

Raising the Bar in Canadian Small Caps

Common Confusion

Equity Markets React to the U.K. Election

Contributor Image
Tim Edwards

Managing Director, Index Investment Strategy

S&P Dow Jones Indices

At the General Election on Thursday, U.K. voters handed a resounding victory to Boris Johnson’s Conservative party.  The British electorate awarded the party with 365 out of 650 seats, the largest outright majority of any U.K. government since 2001, and the biggest victory for the Conservative party since Margaret Thatcher’s final victory in 1987.

Exhibit 1: Johnson wins largest Conservative Majority Since 1987

For once, the polls largely got it right.  A conservative majority had been predicted ever since Johnson’s elevation to Prime Minister on July 23rd, 2019; the market’s reaction on Friday continued along the line of established trends.   Exhibit 2 shows selected winners and losers from Friday’s trading, as well as the cumulative performance of the same indices since the mid-summer.

Exhibit 2: U.K. Equity Election Winners and Losers  

In signs that the market believes the U.K. economy may benefit in the near-term, smaller U.K. companies outperformed larger companies, and companies with more domestically-focused revenues outperformed those with a more international customer base.  Airlines, which had been hammered by the twin threats of a “no deal” Brexit and the Brits’ diminishing holiday purchasing power, soared.  Meanwhile the automobile industry, perhaps nervously anticipating the focus of U.S. / U.K. trade talks, added to the recent declines.

With the pound sterling moving 7% over the past five months, it is tempting to wonder if currency movements (and sensitivities to exchange rates) offer a universal explanation for the recent, relative performances of British equities.  Even in U.S. dollar terms, however, U.K. companies tilted towards domestic customers have made significant gains since June, rising by more than a quarter in total return.  Over the same period, internationally-focused U.K. firms finished flat.

Exhibit 3: Domestic U.K. Firms Have Risen 25% in U.S. Dollar Terms Since June

The U.K. economy, widely viewed as a difficult and stressful place to invest during the fragile governments of former Prime Ministers May and Cameron, may be becoming “investable” once more as the impasse in parliament unblocks.  However, there remains much to do before the U.K. can emerge from negotiations with its European partners.  While the current focus is the exit terms from the trading bloc, a negotiation on the terms of future trade must follow.

The posts on this blog are opinions, not advice. Please read our Disclaimers.

Volatility Did Not Help Active Managers’ Persistence Scores

Contributor Image
Berlinda Liu

Former Director, Multi-Asset Indices

S&P Dow Jones Indices

While many investors appear to believe that winners persist over time, the most recent S&P Persistence Scorecard underscores the well-known disclaimer that “past performance is no guarantee of future results”: irrespective of asset class or style focus, few fund managers consistently outperformed their peers.

Some market participants believe that active managers with successful track records should have the skills to benefit from different market environments. However, volatility in the one-year period ending September 2019 did not help their persistence scores.

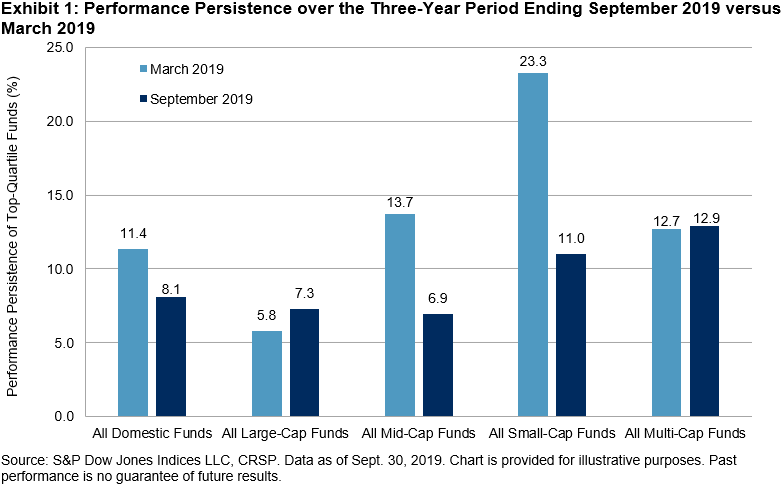
The market experienced ups and downs in the past year amid the uncertainty over Fed policy and trade tensions between the U.S. and China. The sell-off in the fourth quarter of 2018 was offset by the strong rally in the first six months of 2019, the best-performing first half of a year since 1997. For funds categorized as top performers in September 2017, 47% maintained their top-quartile performance in the subsequent year. However, there was a dramatic fall in persistence afterward—just 8% of domestic equity funds remained in the top quartile in the three-year period ending September 2019. Given that the random odds of a top-quartile manager in year one staying in the top quartile in the subsequent two years is 25% * 25% = 6.25%, it appears that top managers in the rising market prior to Q4 2018 navigated the subsequent market turmoil only marginally better than a random drawing.

The S&P Persistence Scorecard also shows that a decline in persistence scores was prominent in small- and mid-cap funds when compared with results from March 2019.

Over a longer investment horizon, we observed even lower performance persistence. At the end of the five-year measurement period, only 0.88% of all domestic equity funds maintained their top-quartile status. No large-cap fund was able to consistently deliver top-quartile performance by the end of the fifth year.

Our latest persistence scorecard highlights the challenge for active managers to consistently beat their peers. If a market participant selects a manager based only on past performance, the chance that the manager would remain in the leading pack is not a far cry from a random drawing.

For more information on performance persistence in U.S. active funds, read our latest Persistence Scorecard.

The posts on this blog are opinions, not advice. Please read our Disclaimers.

2019: A Market Review

Contributor Image
Hamish Preston

Head of U.S. Equities

S&P Dow Jones Indices

With 2019 coming to a close, market participants may use the time to evaluate portfolio performance and to assess what changes (if any) they would like to make based on return expectations and the market outlook.  While the future is uncertain – hindsight really will be 2020 when it comes to evaluating next year’s returns – 2019’s market movements can provide context for where we are and where we may be headed.

2019 has been positive for U.S. equities

In contrast to the gloomy market outlooks to start the year, 2019 has been almost entirely positive for U.S. equities.  The S&P 500 has posted 26 all-time high closing price levels and currently boasts a 27.4% year-to-date total return, while the S&P MidCap 400 (+22.89%) and the S&P SmallCap 600 (+19.90%) have also gained.  More broadly, 42 of the 45 style and sector indices based on the S&P 500, S&P 400, and S&P 600 have risen so far in 2019:  smaller energy companies and small-cap communication services stand as the exceptions.

The Fed, trade tensions, and earnings have driven sentiment so far this year

Despite the broad-based gains in U.S. equities, there have been a few bumps along the way as expectations over future Fed policy, U.S.-China trade tensions, and corporate earnings have taken it in turns to drive sentiment.

For example, better-than-expected corporate earnings, easing trade tensions, and signs of economic growth initially helped the S&P 500 to its best total return through the end of April since 1987, up 18.3%.  But the market was gripped by a case of “he said, Xi said” in May: comments from President Trump and President Xi raised the prospects of tit-for-tat tariffs and led the S&P 500 to a 6.4% monthly decline.

Over the summer, Jerome Powell’s comments that the Fed would “act as appropriate to sustain the expansion” heralded a return to bad news is good news.  Underwhelming economic data fueled expectations for future rate cuts, which in turn were expected to have a positive impact on equities.  This supported the S&P 500 during its best June performance since 1955 – its 7.1% monthly gain also coincided with optimism that trade tensions would ease after the U.S. and China met at the June’s G20 summit.

More recently, the market put its disappointment about July’s “mid-cycle adjustment” in the rear-view mirror:  the S&P 500 recorded 6 consecutive weekly gains as the market got the rate cuts it expected, earnings largely beat expectations, and trade tensions eased.

2020 to be a stock-pickers market? Maybe not

The idiosyncratic reactions of companies to the various drivers of recent market returns has contributed to a decline in correlations.  Some have argued that this means 2020 will be the year of the stock-picker, but this argument is not new: hope springs eternal for active managers.

As we have shown before, a better measure of active management’s alpha opportunity is dispersion:  a greater proportion of large-cap active managers typically underperformed the S&P 500 when dispersion was lower.  Given U.S. large-cap dispersion has remained subdued so far this year, the current environment may pose challenges for many large-cap active managers.

Thank you, Jack Bogle!

Finally, no review of 2019 would be complete without a mention of one of the titans of indexing, John C. Bogle, who died in January.  In the words of Warren Buffett:

“If a statue is ever erected to honor the person who has done the most for American investors, the hands-down choice should be Jack Bogle”.

The posts on this blog are opinions, not advice. Please read our Disclaimers.

Raising the Bar in Canadian Small Caps

Contributor Image
Michael Orzano

Head of Global Exchanges Product Management

S&P Dow Jones Indices

Prior research has demonstrated that profitability matters for small-cap companies in the U.S. and in global equity markets. For example, the S&P SmallCap 600®—which includes an earnings eligibility criteria—has outperformed the broader Russell 2000 Index (with lower volatility) over its 25-year track record.

Our new S&P/TSX SmallCap Select Index extends this phenomenon to Canadian equities, where we have found that a similar effect exists. Simply put, filtering out the “junk” makes a big difference in Canadian small caps. Exhibit 1 illustrates the total return improvement and volatility reduction of the S&P/TSX SmallCap Select Index versus the broader S&P/TSX SmallCap Index over the past 15 years.

How Does the S&P/TSX SmallCap Select Index work?

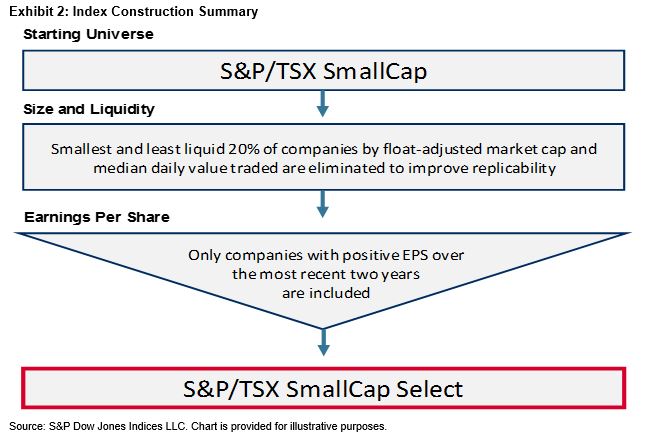
The index follows the same methodology framework as our existing S&P SmallCap Select Index Series, but uses the S&P/TSX SmallCap Index as its selection universe. In order to be eligible for index inclusion, companies must post two consecutive years of positive earnings per share. As a buffer, companies are dropped from the index after posting two consecutive years of negative earnings. In order to improve replicability of the index, we also eliminate the 20% smallest and 20% least liquid companies. The index is weighted by float market cap and is rebalanced semiannually in June and December.

As of the June 2019 index rebalancing, the S&P/TSX SmallCap Select Index included 100 of the 199 companies in the S&P/TSX SmallCap Index and captured about 65% of the float market cap of the benchmark index. As shown in Exhibit 3, the majority of the exclusions were driven by the positive earnings requirement.

To learn more about the impact of including a positive earnings requirement in Canadian small caps, please see our recently published short paper that introduces the S&P/TSX SmallCap Select Index.

The posts on this blog are opinions, not advice. Please read our Disclaimers.

Common Confusion

Contributor Image
Craig Lazzara

Former Managing Director, Index Investment Strategy

S&P Dow Jones Indices

The critics of passive investing are nothing if not creative.  One of their objections to the growth of index funds stems from the putative problem of “common ownership.”  The argument is that index funds’ ownership of many of the competitors in most industries encourages or facilitates collusive behavior.  “[T]he fear is that by owning chunks of many companies in a sector…investors are influencing them to act in ways that maximize gains for all. That is opposed to pushing individual companies to compete more vigorously with rivals and undercut one another on price.”

Many of the fronts in the counterattack against indexing are manned largely by active investment managers; this one, in contrast, seems to be mainly the province of academics, and especially of law professors, some of whom think that index fund ownership of much of corporate America violates anti-trust law.  Probably the most often-cited example of the putative common ownership effect is an academic claim that U.S. airline ticket prices are “10% to 12% higher because of common ownership.”  No one, interestingly enough, claims that index funds explicitly encourage corporate managements to fix prices; rather, index managers supposedly don’t encourage vigorous competition.  “Doing nothing, that is, not pushing portfolio firms to compete aggressively against each other” supposedly produces anti-competitive results because corporate managements know that their shareholders are also owners of their competitors.  “Softer competition” is simply a result of the nature of every corporation’s shareholder registry.

It’s not hard to understand why professors like this argument so much: it’s clever and reflects a basic understanding of industrial structure.  Monopolies are more profitable than competitive markets.  However, making the argument that index funds are the likely driver of monopolistic behavior requires us to believe in two additional propositions:

  1. The sum of the profits of competing firms will be higher if they share a monopoly than if they compete against one another aggressively.
  2. Some shareholders, including (but not limited to) index funds, own shares in more than one competitor, and may therefore be happy with their proportional share in a monopoly.

The problem is that proposition 1 does not depend on proposition 2.  Having a share of a monopoly may be more profitable than competing actively, for both shareholders and firms, even if there is no overlap in ownership.  If there are competitive issues in some industries, index funds can’t be fairly blamed for producing them.

The posts on this blog are opinions, not advice. Please read our Disclaimers.