Get Indexology® Blog updates via email.

In This List

Celebrating 25 Years of the S&P SmallCap 600®

Performance of Latin American Markets in Q3 2019

Staying the Course: S&P MARC 5% Q3 2019 Performance

The Road Less Traveled

Adding Liquidity to the Global Dairy Market – S&P DJI Launches S&P GSCI Skim Milk Powder

Celebrating 25 Years of the S&P SmallCap 600®

Contributor Image
Hamish Preston

Head of U.S. Equities

S&P Dow Jones Indices

Yesterday marked 25 years since the launch of the S&P SmallCap 600.  Since then, the small-cap equity benchmark delivered an annualized total return of nearly 11% and has become the basis for many investment strategies; around USD 73 billion was indexed to the S&P SmallCap 600 as of the end of 2018.  And if we assume that these indexed assets would have otherwise been given to active funds, the rising adoption of the S&P SmallCap 600 helped to save around USD 5 billion in fees between 1996 and 2018.

One of the principal reasons for the growing popularity and awareness of the S&P SmallCap 600 has been its historical performance.  Index construction matters in U.S. small-caps: the S&P 600’s profitability criterion gives it a quality bias, which helped it to consistently outperform other small cap indices such as the Russell 2000 and made it a harder benchmark to outperform for active managers.

More recently, for those seeking to take shelter from the trade winds buffeting the blue-chip, internationally diversified names leading the S&P 500, small-cap stocks can offer a safe harbor, or simply purer exposure to the U.S. economy.  Smaller stocks typically have a higher proportion of their revenues generated in home markets, and the S&P SmallCap 600 has a strong domestic bias compared to the S&P 500.  The performance of the small-cap index over the last 12 months illustrates its close connections to the U.S. economic outlook.

After concerns over U.S. economic growth and future Fed policy weighed on the S&P SmallCap 600 towards the end of 2018, higher domestic revenue exposure provided a degree of insulation from the tariffs, which, in turn, helped the index to post its best ever start to the year (+15.45% through the end of February). The index has since been tested by periodic bouts of uncertainty centering around the health of the U.S. economy, comments by Jerome Powell, and actions by the Federal Reserve.

Since it launched on October 28, 1994, the S&P SmallCap 600 has become a popular way to access the small-cap equity space.  Its outperformance over other small cap indices is a testament to the fact that index construction matters in small cap equities.  Here’s to another 25 years!


The posts on this blog are opinions, not advice. Please read our Disclaimers.

Performance of Latin American Markets in Q3 2019

Contributor Image
Silvia Kitchener

Director, Global Equity Indices, Latin America

S&P Dow Jones Indices

The third quarter was a difficult one for the Latin American region. Meanwhile, it was a mixed bag for global markets—the U.S. ended on a slightly positive note, Europe on a negative one, and Japan also on a positive one, with global markets remaining nearly flat.

The S&P 500® ended the quarter up 1.7%, the S&P Europe 350® posted almost the exact opposite with -1.6%, while Japan’s S&P/TOPIX 150 was up nearly 4%. Latin America’s blue-chip index, the S&P Latin America 40, was down 6.3%. Many internal factors contributed to the region’s underperformance, including reductions in exports, contractions in the industrial and service sectors, soft labor markets, political uncertainty, a slump in commodities prices, and low consumer sentiment. External factors also weighed heavily on the region, primarily the uncertainty surrounding trade negotiations between the U.S. and China.

While all Latin American markets ended in the red for Q3 2019, when comparing with USD-based returns, we noticed that, with the exception of Argentina and Peru, all markets in the region outperformed in USD terms or were flat in local currency terms. This is an example of how currency depreciation can have an impact on performance. The biggest differences were seen in Brazil and Colombia, with the S&P Brazil BMI posting a return of -3.9% in USD but 4.2% in BRL, and, the S&P Colombia Select Index returning -5.7% in USD but a decent 2.3% in COP. Mexico’s headline benchmark, the S&P/BMV IPC, generated a -2.6% total return in USD but was nearly flat in MXN (0.2%).

Overall, most currencies in the region saw significant depreciation during Q3 2019. Argentina led the pack in the depreciation rate for the quarter, with a fluctuation of nearly 60% between the highest and lowest rates. Brazil followed with a fluctuation of 16%, and Colombia followed with a change of nearly 11%.

Interestingly, sectors seemed to offer a clearer picture of the region. It was certainly a tough quarter for most economic sectors, although we still saw defensive sectors like Health Care and Consumer Staples were still able to post positive returns. Real Estate, Consumer Discretionary, and Information Technology also ended the quarter in positive territory. The Materials sector, which includes mining companies, was the worst-performing sector, followed by Financials.

As Exhibit 1 shows, Brazil was the best performer in the region for the quarter. Not surprisingly, most of the best-performing stocks were Brazilian, with BRF S.A., a Consumer Staples company, finishing at the top of the list among the constituents of the S&P Latin America 40, which seeks to track the performance of the leading 40 companies in the region. In terms of indices, the S&P/B3 Momentum Index, which focuses on the top companies in the Brazilian market that show persistence in their relative performance, as measured by their risk-adjusted price momentum score, had the best return for the quarter at 14.5%.

In Mexico, the momentum index was also a top performer among factor strategies. The S&P/BMV IPC CompMx Short-Term Momentum Index returned nearly 4%, significantly higher than the benchmark S&P/BMV IPC’s return (0.2%). However, in Mexico, FIBRAS ruled, and the S&P/BMV FIBRAS Index had an outstanding quarter (10.5%), as much of its returns are attributable to the high yields FIBRAS generate. As of Sept. 30, 2019, the indicated dividend yield for the S&P/BMV FIBRAS Index was 8.1%.

Chile had a relatively flat quarter, with the S&P IPSA returning -0.2%. The worst performers were small-cap stocks, as measured by the S&P/CLX IGPA SmallCap (-7.1%). In terms of sectors, the S&P/CLX IGPA Consumer Staples did the worst (-8.4%). Meanwhile, the S&P/CLX IGPA Real Estate and the S&P/CLX IGPA Industrials had strong returns of 11.1% and 7.3%, respectively.

Peru and Colombia had difficult quarters, with Peru being the worst performer of the two. However, in both markets the best-performing stocks were from the Electric Utilities industry, proving the Utilities sector’s defensive potential during challenging market environments.

As we enter the last quarter of the year, many are already looking forward to 2020. Most economists’ consensus is that Latin America will continue to struggle with market volatility, stagnant economic growth, and political uncertainty. As an optimist, I think there are always investment opportunities in the short- and long-term horizon, despite the tough times. In fact, the diversity of our leading country and regional indices shows exactly that.

For more information on how Latin American benchmarks performed in Q3 2019, read our latest Latin America Scorecard.

The posts on this blog are opinions, not advice. Please read our Disclaimers.

Staying the Course: S&P MARC 5% Q3 2019 Performance

Contributor Image
Joe Kairen

Former Senior Director, Strategy & Volatility Indices

S&P Dow Jones Indices

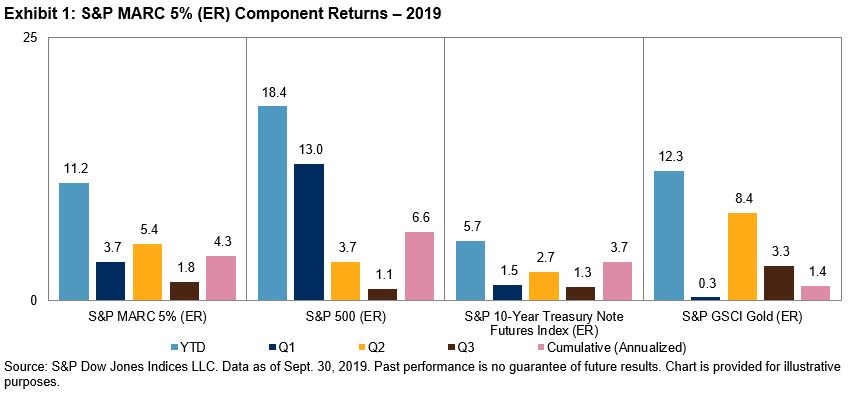
Despite still ending the quarter higher, Q3 2019 was relatively subdued across asset classes when compared to the stellar performance we saw in equities in Q1 and Treasuries and gold in Q2. Exhibit 1 shows that the gains captured in Q1 and Q2 continued to compound in Q3, with the YTD performance of the S&P MARC 5% (ER) reaching 11.2%. As of Q3’s end, all components of the S&P MARC 5% ended in positive territory for each of the three quarters of 2019.

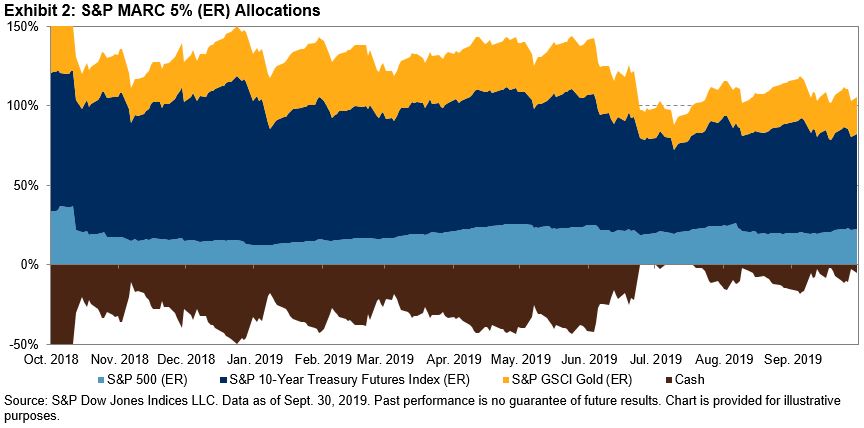
Looking at the index allocations from the beginning of Q3 2018 to the end of Q3 2019 (see Exhibit 2) we see that, while the mix of assets has changed significantly throughout this time, with equities taking a less prominent role due to the volatility seen at year-end 2018, the index continued to be over 100% allocated across the various asset classes at least 95% of the time. Despite Q4 2018’s volatility, the index only dropped below 100% on 15 days over the past year, keeping the strategy allocated to its underlying asset classes and not cash.

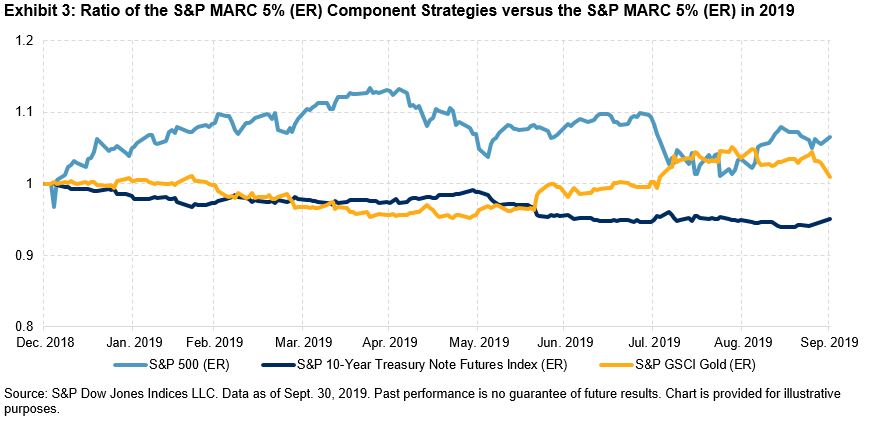
When looking at the relative performance of the S&P MARC 5% (ER) components versus the S&P MARC 5% (ER) itself, one can see that for the first half of the year, the gold and fixed income components actually lagged in performance. This changed toward the end of Q2 through mid-Q3, when gold also joined equities in outperforming the S&P MARC 5% (ER) on a relative return basis. The strength of the components allowed the S&P MARC 5% to start Q4 with a strong YTD performance, while still capturing the diversification built into the index.

During the 64 days in Q3 2019, we can see that for any of the rolling 252-day periods, the return of the S&P MARC 5% (ER) would have been positive despite the inconsistency of returns in most of its components. It’s also worth noting that across this period of time, the lowest rolling 252-day return for the S&P MARC 5% (ER) was 8.6% and the highest return was 13.4%—with an average return of 11.4%.

The posts on this blog are opinions, not advice. Please read our Disclaimers.

The Road Less Traveled

Contributor Image
Chris Bennett

Former Director, Index Investment Strategy

S&P Dow Jones Indices

It is a truth universally acknowledged that liquidity is critical to market health; typically when liquidity falls, volatility rises.  The Financial Times recently cited claims that the increased use of passive investment vehicles had caused trading volumes in individual S&P 500 constituents to decline.  Should we be alarmed?

In reality, the notion that single-stock traders only add liquidity, while passive vehicles only diminish it, is wrong.  There are a great many active users of “passive” products, and any market-wide conclusions about liquidity require analysis not only of single stocks, but also of the ETFs and futures that track them.  A wider perspective is required because the volume of trading in ETFs, futures, and other index-based exchange-traded products is substantial.  Our research shows that there was an equivalent of around $127 trillion traded in products tracking the S&P 500 over the 12 months ending June 2019, while the implied average holding period across all S&P DJI index-linked exchanged traded products included in the report was 11 days.

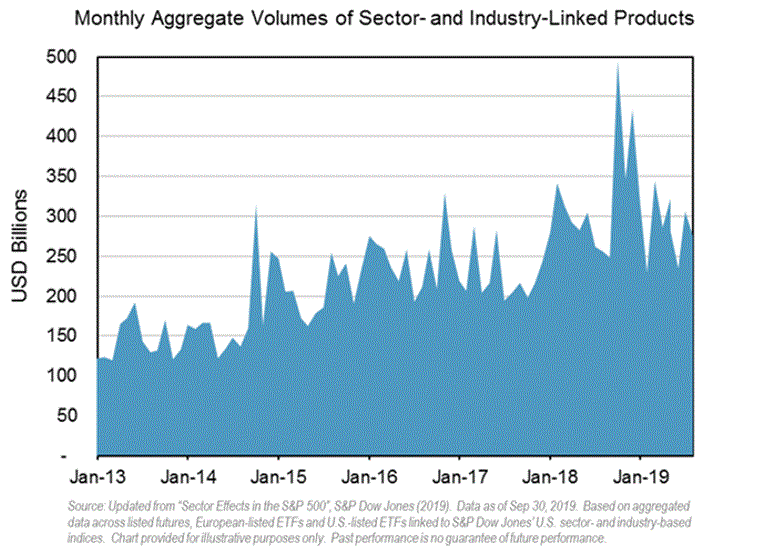
To offer just one example that might broaden our perspective, consider how volumes in sector and industry-based products have grown over the past few years.  The assets, open interest, and trading volume in futures and ETFs tracking S&P DJI’s U.S. based sector and industry products has more than doubled.

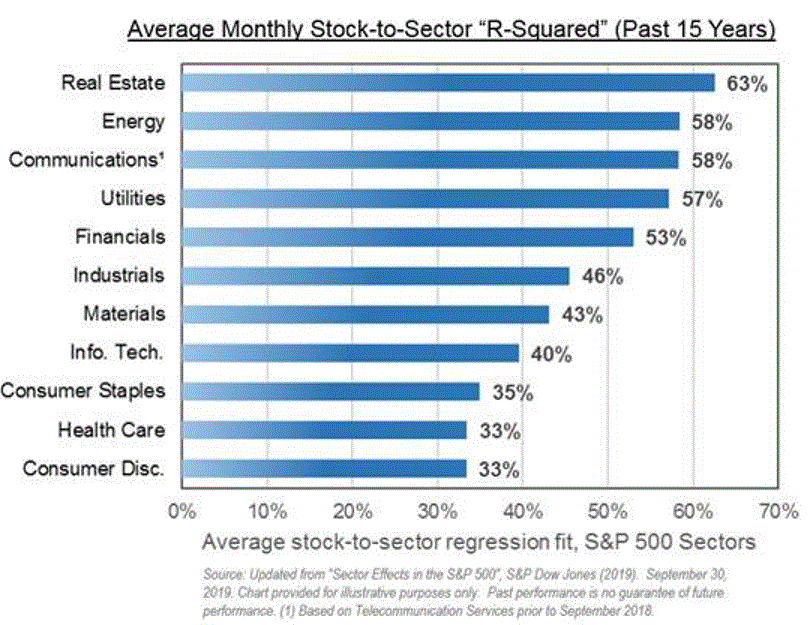
In part, this may be a simple reflection of the recently increasing importance of sectoral drivers to stocks in the S&P 500.   At any rate, sectors have a long-term importance to stock returns.  Around half of all the daily variations in S&P 500 single stock returns over the past 15 years may be attributed to risks shared with their sectoral peers.

Because of their current liquidity and importance to returns, sector products can be, and often are, used to make active bets in place of individual stocks.  Individual stock volumes tell only part of the story, as investors may be choosing to use different vehicles to express their views.   An active manager who over- or under-weights a sector makes no less a contribution to price discovery and market efficiency than a manager who over- or under-weights the sector’s components.    Individual securities may currently be the road less traveled, but markets can arrive at accurate valuations from a different road.

The posts on this blog are opinions, not advice. Please read our Disclaimers.

Adding Liquidity to the Global Dairy Market – S&P DJI Launches S&P GSCI Skim Milk Powder

Contributor Image
Fiona Boal

Managing Director, Global Head of Equities

S&P Dow Jones Indices

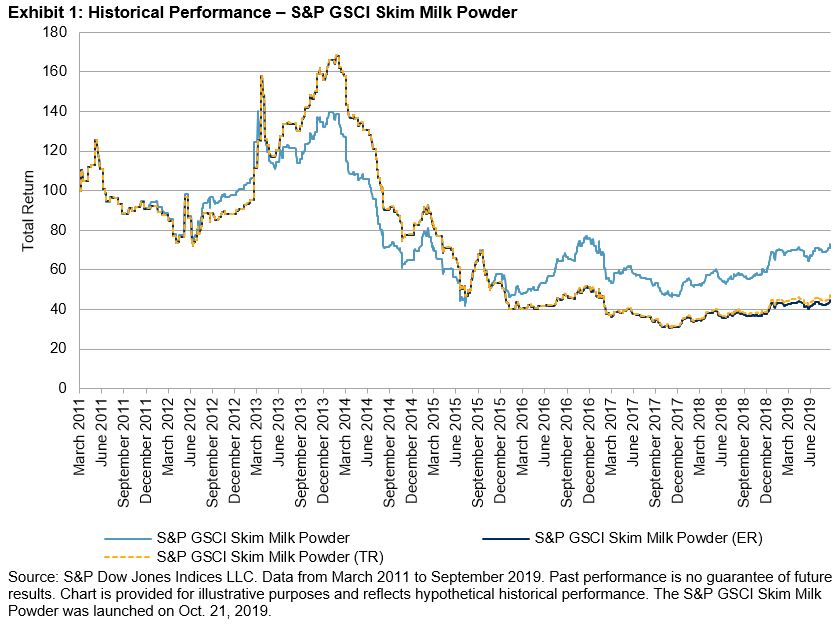
On Oct. 21, 2019, S&P Dow Jones Indices (S&P DJI) launched the S&P GSCI Skim Milk Powder, an expansion of the single-commodity series offering of indices based on the S&P GSCI and the first index of its kind in the market. The S&P GSCI Skim Milk Powder is designed to provide investors with a reliable and publicly available investment performance benchmark for skim milk powder (SMP).

The S&P GSCI Skim Milk Powder is based on the NZX SMP futures contract, and it represents the first Oceania-based single-commodity index for the S&P GSCI index series.

Until now, dairy has been an inaccessible commodity for many market participants. The S&P GSCI Skim Milk Powder seeks to offer access to the return stream of a unique asset that is uncorrelated to major commodities such as gold but, at the same time, has a strong relationship to the New Zealand dollar and the New Zealand equity market.

There may also be opportunities for participants in the physical dairy market to utilize financial products based on the S&P GSCI Skim Milk Powder in conjunction with other risk management instruments. Broadening the financial instruments available to hedgers in the global dairy market is an important goal of the S&P GSCI Skim Milk Powder.

The S&P GSCI Skim Milk Powder joins the following two additional S&P GSCI dairy commodity indices that were launched by S&P DJI earlier this year based on CME futures contracts by the same name.

  1. The S&P GSCI Nonfat Dry Milk, which is designed to provide investors with a reliable and publicly available benchmark for investment performance in the dry milk market.
  2. The S&P GSCI Class III Milk, which seeks to provide investors with a reliable and publicly available benchmark for investment performance in the milk market.

The Global Dairy Market in Perspective

According to the International Dairy Federation, the consumption of dairy products is expected to increase by 25% between 2015 and 2024. While SMP is only a relatively small proportion of global dairy consumption, it is a large proportion of the global dairy trade. The dairy export market is dominated by milk powder, with approximately 3.9 million metric tons of SMP and whole milk powder traded annually.

Importance of Dairy to the New Zealand Economy

Dairy represents the largest export industry in New Zealand, and the dairy sector contributes NZD 7.8 billion (3.5%) to New Zealand’s total GDP. Export revenue from dairy farming was NZD 15.1 billion in 2017-2018, equivalent to 28% of the total value of New Zealand’s merchandise exports. This is more than two times the meat sector, three times the wood sector, and seven times the wine sector. New Zealand is the third-largest SMP exporter in the world after the EU and the U.S. China is most important destination for New Zealand’s dairy product exports.


The posts on this blog are opinions, not advice. Please read our Disclaimers.