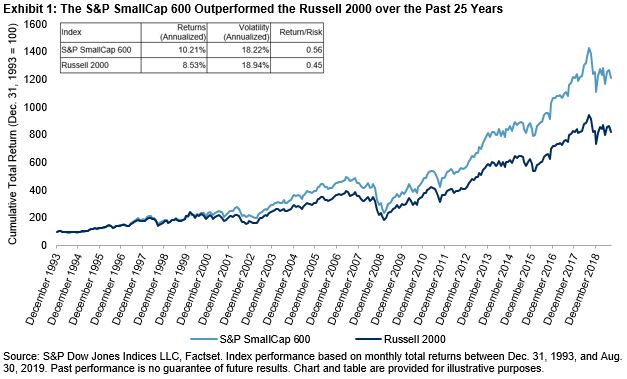
Market participants generally expect risk/return profiles to be similar across broad market indices representing the same universe. However, indices’ risk/return characteristics can vary substantially. As of Aug. 31, 2019, the S&P SmallCap 600® returned 10.21% per year since year-end 1993, while the Russell 2000 returned 8.53%.
So why is there a substantial risk/return gap between the two small-cap U.S. equity indices? In 2009, S&P Dow Jones Indices published a study that highlighted the impact of the S&P SmallCap 600’s financial viability screen.[1] Requiring index constituents to have a history of positive earnings was meaningful in explaining the S&P SmallCap 600’s outperformance and its quality bias compared with the Russell 2000. A five-year update to the study confirmed these results: the S&P SmallCap 600 continued to outperform, driven predominantly by a quality premium.[2]
To celebrate the 10-year anniversary of the first study, we recently published another update to the research, looking into the differences in methodology between the S&P SmallCap 600 and the Russell 2000. In addition to the profitability criteria, we assessed the impact of two index inclusion criteria—liquidity and public float—that are present in the S&P SmallCap 600 but absent in the Russell 2000.
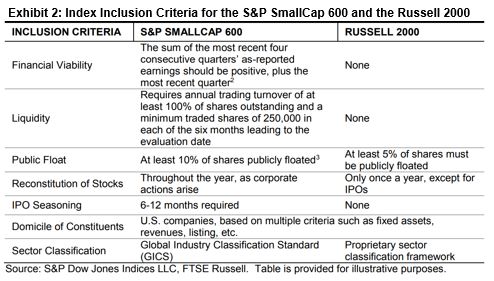
All else equal, small-cap companies (in the U.S. as well as around the world) with higher profitability, higher liquidity, and higher investability tend to earn higher returns than those with lower profitability, liquidity, and investability. Given the differences in index construction, these characteristics help to explain the potential performance advantage of the S&P SmallCap 600.
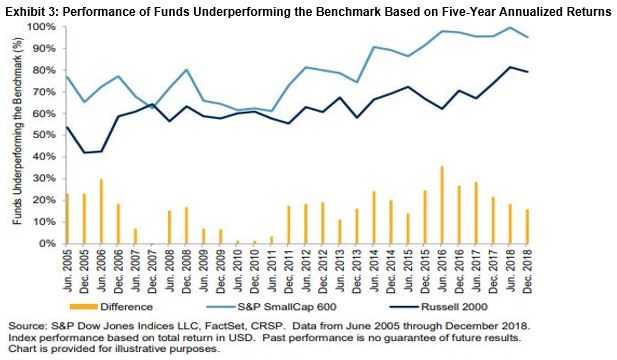
In light of the historical outperformance of the S&P SmallCap 600 compared with the Russell 2000, it is perhaps unsurprising that a greater proportion of active small-cap managers underperformed the S&P SmallCap 600 than the Russell 2000, historically. For example, using data from our SPIVA U.S. Year-End 2018 Scorecard, 78% of small-cap funds underperformed the S&P SmallCap 600 over three-year time horizons, on average. This compared with 62% underperforming the Russell 2000, on average, over the same periods. Exhibit 3 shows that the results were similar using five-year annualized returns.
As a result, market participants may wish to keep in mind the potential influence of index construction on risk/return characteristics: the outperformance of the S&P SmallCap 600 versus the Russell 2000 over the past 25 years highlights that not all benchmarks are created equal. Knowing key return and risk drivers of the small-cap market segment may present opportunities to capture broad market exposure while avoiding pitfalls inherent in the small-cap space.
[1] S&P Dow Jones Indices defines financial viability as when the sum of the four most recent consecutive quarters’ reported earnings is positive, as well as those of the most recent quarter.
Soe, Aye and Srikant Dash, “A Tale of Two Benchmarks.” S&P Dow Jones Indices, July 2009.
[2] Soe, Aye and Phillip Brzenk. “A Tale of Two Benchmarks: Five Years Later.” S&P Dow Jones Indices, March 2015.
The posts on this blog are opinions, not advice. Please read our Disclaimers.