Get Indexology® Blog updates via email.

In This List

Factor Analysis of U.S. Small-Cap Benchmarks

Does Size Affect the Active versus Passive Score of Small-Cap Mutual Funds?

Commodities September – Short-Term Supply Shocks

Index Construction Matters in U.S. Small Cap

S&P 500 Quality High Dividend Index In Volatile Markets

Factor Analysis of U.S. Small-Cap Benchmarks

Contributor Image
Phillip Brzenk

Managing Director, Global Head of Multi-Asset Indices

S&P Dow Jones Indices

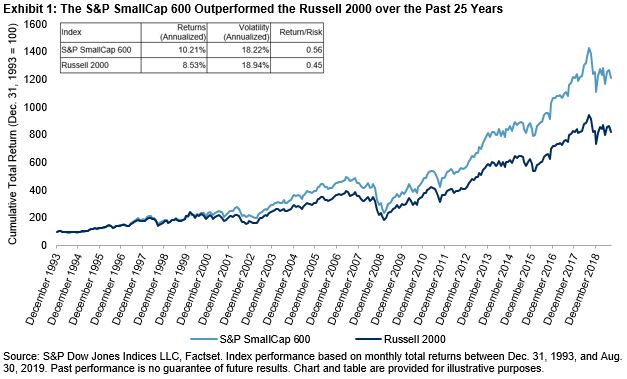
We recently published the 10-year anniversary edition of the paper “A Tale of Two Small-Cap Benchmarks,” which gives insight into why the S&P SmallCap 600® outperformed the Russell 2000, historically.[1] Our latest paper also showed that, in the period from Dec. 31, 2002, to Dec. 31, 2018, profitable companies typically outperformed unprofitable companies in the U.S. small-cap market.[2] Given the S&P SmallCap 600 employs a profitability screen, this blog uses both returns-based and holdings-based factor analyses to gauge the actual impact compared with the Russell 2000.[3]

We begin with a returns-based regression analysis,[4] adding a quality factor to the standard Fama-French three-factor (market, size, and value) model. We use profitability as a proxy for quality given it is a key component in measuring quality. Exhibit 1 shows the regression results from the period between Dec. 31, 1993, and June 30, 2019.

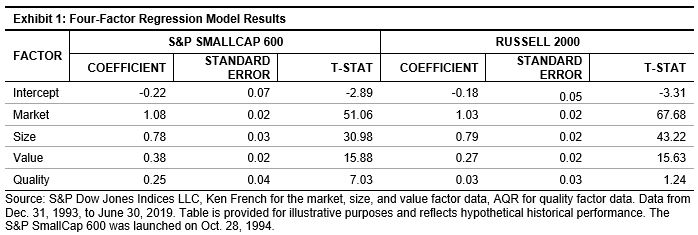
Exhibit 1 shows that the two benchmarks had similar exposures to the standard three factors. However, there was a stark contrast in quality factor exposures: the S&P SmallCap 600 had a positive and statistically significant exposure to quality, while the Russell 2000’s near-zero exposure was statistically insignificant. This suggests that the S&P SmallCap 600 benefited by better capturing the quality factor returns, historically.

Next, we use a commercial risk model to see the active fundamental factor exposures for the S&P SmallCap 600 compared with the Russell 2000. This method could be considered a more‑robust process in measuring factor exposures since it looks at each benchmark’s holdings instead of relying on return regressions. Exhibit 2 shows the average active exposure of the profitability factor for the S&P SmallCap 600 relative to the Russell 2000 in each of the last 16 years. There is clearly a consistent, positive active exposure to the profitability factor for the S&P SmallCap 600, regardless of market environment.

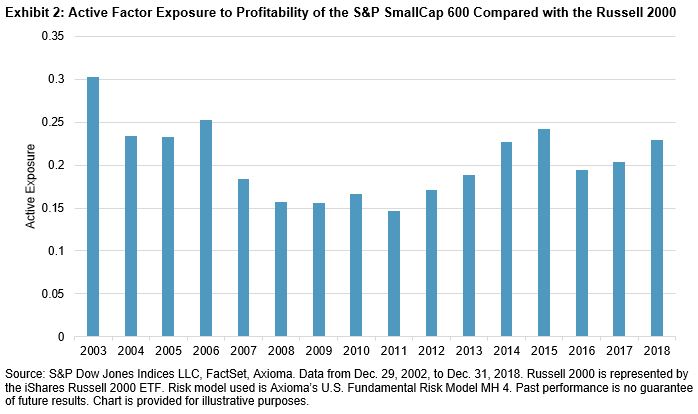
Exhibit 3 gives a summary of average annual active exposures and factor returns of all factors in the model. The last column shows the impact—or excess return—attributable to each factor, calculated as the product of the active exposure and factor return.

Out of all factors in the model, the S&P SmallCap 600 had the highest tilt toward the profitability factor, and this positive tilt contributed to its outperformance over the Russell 2000; the compounded impact attributable to the profitability factor is approximately 0.71% on an average annualized basis.

As a result, the S&P SmallCap 600’s profitability requirement resulted in a positive quality tilt relative to the Russell 2000. This tilt played a material role in explaining the long-term outperformance of the S&P SmallCap 600.

For more information, check out our research paper “A Tale of Two Small-Cap Benchmarks: 10 Years Later.”

[1] Also see our previous blog, “Index Construction Matters in U.S. SmallCap,” by Aye Soe.

[2] See Exhibit 7 in A Tale of Two Small-Cap Benchmarks: 10 Years Later for more details.

[3] See Exhibit 3 in A Tale of Two Small-Cap Benchmarks: 10 Years Later for more details.

[4] See Exhibit 14 in A Tale of Two Small-Cap Benchmarks: 10 Years Later for more details.

The posts on this blog are opinions, not advice. Please read our Disclaimers.

Does Size Affect the Active versus Passive Score of Small-Cap Mutual Funds?

Contributor Image
Berlinda Liu

Former Director, Multi-Asset Indices

S&P Dow Jones Indices

In my earlier blog, we explored the effect of size on active large-cap equity funds’ performance. We ranked all long-only active large-cap equity funds by their size at the beginning of the observation period and divided them into quartiles, with the first quartile being the largest and the fourth being the smallest. We found that, in general, the largest ones tended to lead by returns, volatilities, survival rates, and the ability to outperform the benchmark.

In this blog, we performed a similar analysis of the small-cap funds. Our study shows the diminished advantage of larger funds in this space. Small-cap funds of all quartiles underperformed the S&P SmallCap 600® across mid- and long-term investment horizons.

During the test period ending in March 2019, the S&P SmallCap 600 lagged three out of four quartiles of small-cap funds over the past year, but outperformed all quartiles across the mid- and long-term investment horizons (see Exhibit 1). Unlike the large-cap funds, the largest small-cap funds did not always generate higher annualized returns than their peers. In the past 15 years, annualized returns in the first, second, and third quartiles were quite similar.

Not surprisingly, the majority of small-cap funds in all quartiles underperformed the S&P SmallCap 600 over the mid- to long-term investment horizons. If we assume that all “dead” funds underperformed the benchmark, then more than 90% of each group underperformed the benchmark over the past 15 years, and the largest funds had the lowest underperformance percentage among the four groups. However, if we account only for funds that survived the testing periods, then the third quartile funds had the lowest percentage of underperformance compared with the S&P SmallCap 600 (see Exhibit 2).

Furthermore, the S&P SmallCap 600 generated similar or lower volatilities compared with active small-cap funds over all time periods analyzed (see Exhibit 3).

Interestingly, our analyses show that the larger funds had a significantly higher survival rate than their smaller peers, especially over longer horizons (see Exhibit 4). Only 41% of the third quartile funds that existed at the beginning of the 15-year study period survived the entire period, compared with a survival rate of 71% for the larger funds over the same period.

Our study shows that the relatively simple and transparent S&P SmallCap 600, a beta exposure to the U.S. small-cap space, outperformed the majority of small-cap funds (on a return and risk-adjusted basis), regardless of AUM over the long term.

The posts on this blog are opinions, not advice. Please read our Disclaimers.

Commodities September – Short-Term Supply Shocks

Contributor Image
Fiona Boal

Managing Director, Global Head of Equities

S&P Dow Jones Indices

Despite the largest one-day spike in oil prices since at least 1989, the broad commodities market only managed to climb modestly in September. The S&P GSCI was up 1.7% for the month and 8.6% YTD. The Dow Jones Commodity Index (DJCI) was up 1.4% in August and up 4.7% YTD. Rallies in the agriculture and livestock markets were in contrast to weaker gold prices and modest upswings in the energy and industrial metal markets.

The S&P GSCI Petroleum ended the month up only 0.8%, an almost impossibly meek rise given the significant, albeit short lived, rise in oil prices mid month. The Sept. 14, 2019, attacks on Saudi Arabia’s oil facilities put the oil market back in focus for investors and policy makers alike. The event was reported to have been the largest single supply disruption in the oil market for half a century, crippling half of Saudi oil production and temporarily halting production of 5.7 million barrels per day, or approximately 5% of global oil production. The price response on the first trading day following the attack was extreme but now looks like an aberration. The S&P GSCI Brent Crude Oil closed 14.2% higher on Sept. 16, 2019, the biggest one-day percentage gain since at least 1989, but by month end, it was only up 1.7%. Reports that Saudi Arabia had managed to replace much of the production lost in the attacks by increasing output from offshore fields and drawing down inventories eased earlier fears regarding a shortage of crude, at least over the short term. Most global economic indicators point to a worldwide slowdown in economic growth, led by business investment and manufacturing, which does not augur well for oil demand.

Middling performance was on display in September for industrial metals, with the S&P GSCI Industrial Metals up 0.6%. S&P GSCI Nickel cooled off, down 4.5% on the month, while S&P GSCI Zinc was up 9.3%. The International Lead and Zinc Study Group reported that the global zinc market registered an unexpected deficit in the first half of the year. S&P GSCI Iron Ore was the outperformer in September, up 12.7%, and back above 65% higher for the year, competing with nickel for the top YTD performer in the commodity complex. More encouraging rhetoric between China and the U.S. ahead of the resumption of trade talks and slightly better Chinese economic data helped give iron ore a boost.

The S&P GSCI Precious Metals edged lower by 3.9% in September following last month’s impressive price spike. With more investor appetite directed toward risk assets, interest in safe haven assets like gold was tempered. S&P GSCI Palladium moved higher by 7.2% over the month, as mining companies forecast a widening supply deficit for the metal.

As is the nature of the major grain markets and USDA reporting, it was not until the last day of the month that grain markets moved markedly. The USDA Quarterly Grain Stocks report released on Sept. 30, 2019, showed U.S corn and soybean stocks at levels notably below pre-report projections. The S&P GSCI Grains finished the month up 5.5%. An announcement mid month that the Chinese government would support purchases of U.S. agricultural products by Chinese companies by waiving tariffs also supported prices. The S&P GSCI Cocoa ended the month up 10.1%, driven by reports that middlemen in Ivory Coast were stockpiling significant quantities of cocoa beans in anticipation of a higher farm gate price, which was due to kick-in on Oct 1, 2019.

Lean hogs led the livestock markets higher in September; the S&P GSCI Livestock up 7.8% for the month. Concessions on punitive tariffs on U.S agricultural exports to China were supportive to both hog and cattle prices, as was news of the spread of African swine fever (ASF). South Korea confirmed the first case of ASF in that country in the middle of the month. While the long-term impact on global hog markets will depend on the ability of South Korean officials to contain the disease, it does not bode well for the spread of the disease across Asia.

The posts on this blog are opinions, not advice. Please read our Disclaimers.

Index Construction Matters in U.S. Small Cap

Contributor Image
Aye Soe

Former Managing Director, Global Head of Core and Multi-Asset Product Management

S&P Dow Jones Indices

Market participants generally expect risk/return profiles to be similar across broad market indices representing the same universe. However, indices’ risk/return characteristics can vary substantially. As of Aug. 31, 2019, the S&P SmallCap 600® returned 10.21% per year since year-end 1993, while the Russell 2000 returned 8.53%.

So why is there a substantial risk/return gap between the two small-cap U.S. equity indices? In 2009, S&P Dow Jones Indices published a study that highlighted the impact of the S&P SmallCap 600’s financial viability screen.[1] Requiring index constituents to have a history of positive earnings was meaningful in explaining the S&P SmallCap 600’s outperformance and its quality bias compared with the Russell 2000. A five-year update to the study confirmed these results: the S&P SmallCap 600 continued to outperform, driven predominantly by a quality premium.[2]

To celebrate the 10-year anniversary of the first study, we recently published another update to the research, looking into the differences in methodology between the S&P SmallCap 600 and the Russell 2000. In addition to the profitability criteria, we assessed the impact of two index inclusion criteria—liquidity and public float—that are present in the S&P SmallCap 600 but absent in the Russell 2000.

All else equal, small-cap companies (in the U.S. as well as around the world) with higher profitability, higher liquidity, and higher investability tend to earn higher returns than those with lower profitability, liquidity, and investability. Given the differences in index construction, these characteristics help to explain the potential performance advantage of the S&P SmallCap 600.

In light of the historical outperformance of the S&P SmallCap 600 compared with the Russell 2000, it is perhaps unsurprising that a greater proportion of active small-cap managers underperformed the S&P SmallCap 600 than the Russell 2000, historically. For example, using data from our SPIVA U.S. Year-End 2018 Scorecard, 78% of small-cap funds underperformed the S&P SmallCap 600 over three-year time horizons, on average. This compared with 62% underperforming the Russell 2000, on average, over the same periods. Exhibit 3 shows that the results were similar using five-year annualized returns.

As a result, market participants may wish to keep in mind the potential influence of index construction on risk/return characteristics: the outperformance of the S&P SmallCap 600 versus the Russell 2000 over the past 25 years highlights that not all benchmarks are created equal. Knowing key return and risk drivers of the small-cap market segment may present opportunities to capture broad market exposure while avoiding pitfalls inherent in the small-cap space.

[1]   S&P Dow Jones Indices defines financial viability as when the sum of the four most recent consecutive quarters’ reported earnings is positive, as well as those of the most recent quarter.
Soe, Aye and Srikant Dash, “A Tale of Two Benchmarks.” S&P Dow Jones Indices, July 2009.

[2]   Soe, Aye and Phillip Brzenk. “A Tale of Two Benchmarks: Five Years Later.” S&P Dow Jones Indices, March 2015.

The posts on this blog are opinions, not advice. Please read our Disclaimers.

S&P 500 Quality High Dividend Index In Volatile Markets

Contributor Image
Qing Li

Director, Global Research & Design

S&P Dow Jones Indices

The U.S. stock market has experienced a decade-long bull market since the global financial crisis. In fact, from March 9, 2009, to Sept. 6, 2019, the S&P 500® delivered a strong gain of 448% on a total return basis.

For market participants who fear an economic slowdown and a stock market pullback, the S&P 500 Quality High Dividend Index, a dividend strategy that incorporates a quality factor,[i] may aid in providing defensive characteristics.

Focusing on quality and dividend yield, the S&P 500 Quality High Dividend Index has delivered significant outperformance over the long term relative to the broader market. In nearly 25 years of history, the strategy produced an annualized return of 13.26%, compared with 9.89% from the overall U.S. equity market as indicated by the S&P 500 (see Exhibit 1). Taking volatility into consideration, the S&P 500 Quality High Dividend Index offered a risk-adjusted return of 0.94, which is 38% higher than that of the S&P 500.

Besides the superior long-term returns, the S&P 500 Quality High Dividend Index has sustained a consistently higher dividend yield. On average, the strategy offered a 2.9% dividend yield compared with its benchmark’s 2% during the 15-year horizon (see Exhibit 2).

Since its inception, the S&P 500 Quality High Dividend Index has demonstrated defensive characteristics by outperforming in down markets. Using monthly return data, we calculated upside and downside capture ratios to measure how the S&P 500 Quality High Dividend Index performed during up and down markets. The strategy’s 73.2% downside capture ratio indicates that if the broader market declines 10%, the S&P 500 Quality Dividend Index would fall 7.3%, or 27% less than the benchmark. On the other hand, the strategy captured 93.8% gains of the upside markets historically, indicating nearly full engagement in rising markets.

Exhibit 3 shows how the S&P 500 Quality High Dividend Index performed during the five most severe drawdown periods. The strategy topped its benchmark during all the turbulent periods and returned an average excess gain of 13.1%. The most noticeable performance occurred when the dotcom era ended on Sept. 1, 2002. While the S&P 500 tumbled more than 47% from its peak, the S&P 500 Quality High Dividend Index stayed in positive return territory and delivered 51.4% excess return over the benchmark.

Furthermore, when the broad market rebounded to its previous peaks, the strategy delivered higher returns during the same time horizons, as shown in Exhibit 4.

Through the combination of quality and high dividend yield, the S&P 500 Quality High Dividend Index captured the majority of the uptrend in markets but incurred less loss in down markets.


[i] Quality score is calculated using return-on-equity, accruals ratio, and financial leverage. Please refer to S&P Quality Indices Methodology for details.

The posts on this blog are opinions, not advice. Please read our Disclaimers.