The first half of 2019 saw one of the biggest rallies in the domestic market; the S&P 500® rose 18.54% on a total return basis despite concerns of slow economic growth, a trade war, and a possible rate hike. During the same period, the S&P 500 Low Volatility Index surprised the market and rose even more. The index outperformed the broad market by 99 bps in the first six months, and 90 bps in the second quarter.
The S&P 500 Low Volatility Index generally tends to outperform in down markets and underperform in up markets. However, the first half of 2019 reminds us that, as its name would suggest, the S&P 500 Low Volatility Index’s outperformance partly comes from its ability to reduce volatility drag. As a result, it may even beat the market when it zigzags on its way up.
Before we discuss the relationship between market volatility and index performance, it is important to first define “volatility spike.” In particular, market participants should focus on what level of volatility is considered to be high and what kind of volatility movement is a “volatility spike”.
For our analysis, we will first compute market volatilities using a 21-trading-day rolling window and then use the one-year median to evaluate realized volatility. We will consider volatility above its one-year mean as a spike and deem this level as high.
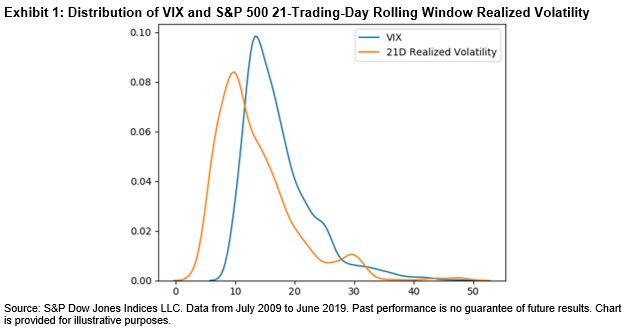
When it comes to volatility distribution, either implied or realized, the sample median is usually more representative than the sample mean. The distribution of VIX® levels and the equity market’s 21-trading-day realized volatility in the past 10 years clearly shows that implied and realized volatilities were heavily skewed (see Exhibit 1). Although the majority of the data points clustered to the left of the distribution, the fat tail on the right significantly pulled the sample mean above its median. Exhibit 2 further confirms that average volatility was higher than median volatility. Note that the 2008 financial crisis data was not included in this sample set; otherwise, the gap between mean and median would be even larger.
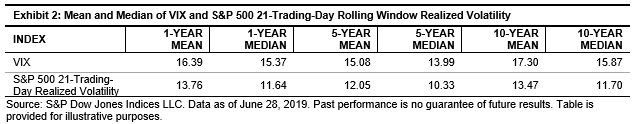
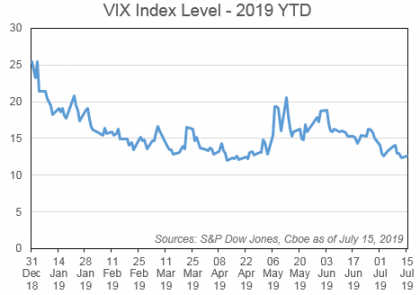
Furthermore, using a relatively short lookback period can help us identify local volatility spikes that are relevant to market performance. We can see from Exhibit 2 that mean and median vary, depending on the length of lookback period, indicating volatility regime shifts in history. The realized volatility of the S&P 500 in May 2019 was 14.29%. It may look tame compared with the index’s long-term average volatility (17.5% since 1990), but it has more than doubled from one month ago (6.14%).
We plotted the monthly excess returns of the S&P 500 Low Volatility Index over the past 10 years against the broad market monthly volatility (see Exhibit 3). We also included the one-year moving average and the moving median of 21-trading-day market volatilities, both calculated daily.

We can make the following observations from the past 120 months.
- The volatility spiked 51 times, 34 of which had positive excess returns. In other words, if volatility rose above its one-year median, the probability of the S&P 500 Low Volatility Index beating the market was 67%.
- The S&P 500 Low Volatility Index outperformed in 56 months; 61% of those months also had volatility spikes.
- We saw 17 months in which the S&P 500 Low Volatility Index had excess returns greater than 2%. Out of those 17 months, 14 of them (82%) were also months with volatility spikes.
Exhibit 2 also shows that the mean and median of market volatility in the past year exceeded those of the past five years, suggesting that the market might be gradually moving out of its low volatility regime of recent years. The widening spread between the one-year mean and one-year median also reminds us of the shocks in late 2018.
It would not be surprising for market participants if low volatility factor strategies continued to perform better than a rising equity market, as long as volatility remained above its median.
The posts on this blog are opinions, not advice. Please read our Disclaimers.