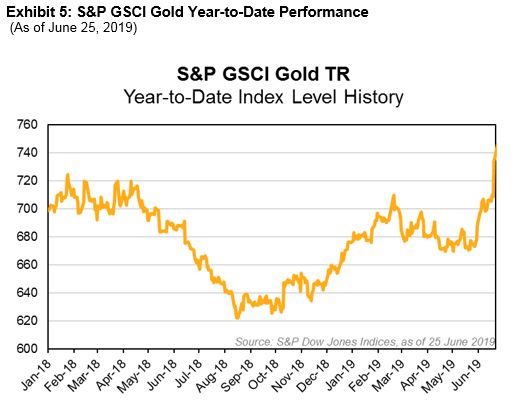
The second quarter of 2019 reinforced the upside potential of S&P MARC 5% Excess Return (ER) Index diversification, which compliments traditional risk management benefits. With the equities and fixed income components having good, but not stellar, Q2 performance, we have to look to gold to understand the driver of the S&P MARC 5% (ER) Index’s performance. Gold, as measured by the S&P GSCI Gold, started the quarter primarily in negative territory but turned positive toward the beginning of June and rose significantly on the back of a dovish Fed.

With all three component indices within the S&P MARC 5% (ER) Index ending positive on the quarter, much of the gain in gold occurred between June 19, 2019 and June 20, 2019, when the Fed released its newest policy statement and, just as importantly, its interest rate projections. The lift in gold contributed significantly to the performance of the S&P MARC 5% (ER) Index for Q2 2019, with the weighted return for the single day contributing 1% to the S&P MARC 5% (ER) Index.

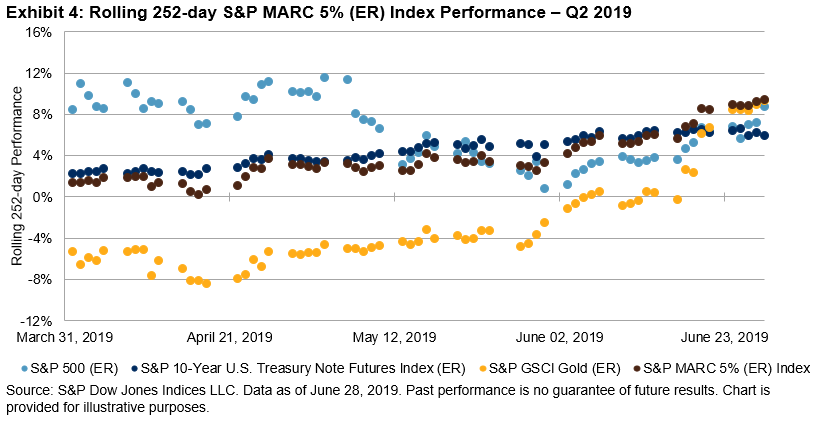
When looking at the relative returns of the components of the S&P MARC 5% (ER) Index versus the index itself, you can observe that the diversification still held in Q2 2019, though the index also managed to capture relatively sizeable shifts in any given asset class. This can best be seen toward the right side of the chart, where the outsized relative performance caused equities and fixed income to underperform the S&P MARC 5% (ER) Index, despite each being positive for the quarter (see Exhibit 3).

Looking at the rolling 252-day performance for the 63 days in the quarter, we can see that for any of the 252-day periods, the return of the S&P MARC 5% (ER) Index would have been positive despite the inconsistencies in most of its components. It is also worth noting that, because of the diversification of the index, during the past few observation periods ending in June 2019, the S&P MARC 5% (ER) Index also outperformed each of the individual asset classes over the 252-day period.