Get Indexology® Blog updates via email.

In This List

Managing Geographical Revenue Exposure in the Australian Equities Market

A Changing Stride for an Ageing Bull

Dividend Payers Outperform Non-Dividend Payers in Colombia

The Case for Dividend Futures Contracts

Uncertainty’s Curse on Confidence

Managing Geographical Revenue Exposure in the Australian Equities Market

Contributor Image
Arpit Gupta

Former Senior Analyst, Global Research & Design

S&P Dow Jones Indices

The S&P/ASX 200, widely considered a performance barometer for the Australian equities market, comprises 200 of the most liquid and highest market capitalization stocks listed on the Australian Securities Exchange (ASX). Nevertheless, the performance of this index is not solely influenced by Australian economic activities, but also by global economic conditions, depending on the individual securities’ geographical revenue exposure. As of May 17, 2019, 64% of S&P/ASX 200 members’ revenue was sourced domestically, while 36% of their revenue was exposed to foreign markets such as the U.S., Europe, New Zealand, and China (see Exhibit 1).

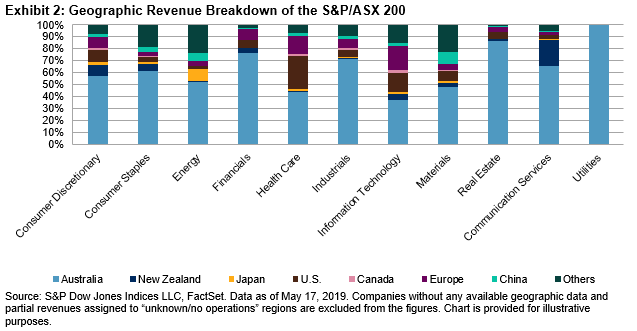
Apart from the Utilities sector, where revenue was not exposed to foreign markets, all other sectors were exposed to foreign markets at varying degrees. The Information Technology sector had the highest foreign revenue exposure (63%), followed by Health Care (56%) and Materials (52%). Foreign revenue exposure in the Health Care and Information Technology sectors was dominated by the U.S. and Europe, while foreign revenue in the Materials sector had the highest market exposures to China and the U.S. In contrast, revenue in the Real Estate and Financials sectors was predominantly domestic, with only 13% and 24% coming from foreign markets, respectively (see Exhibit 2).

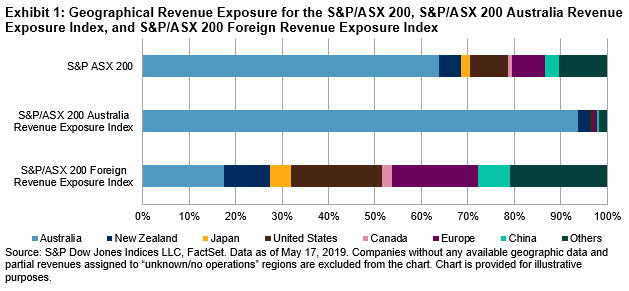
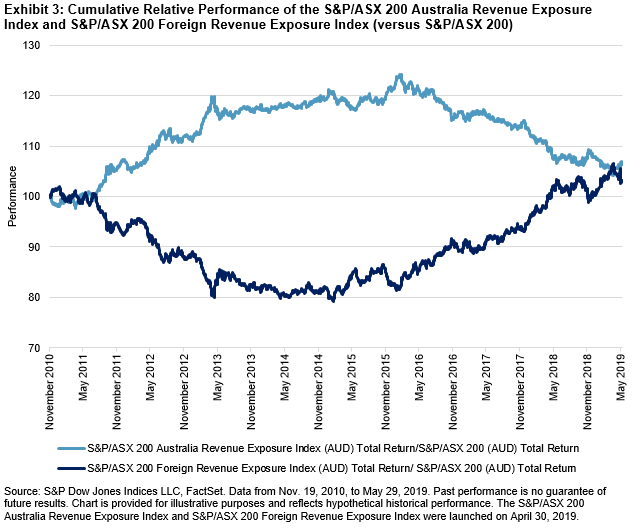
When domestic and international macroeconomic conditions diverge, investors may want to manage the geographical revenue exposure of their portfolios to capture more favorable returns or to lower the risk of macroeconomic shocks. Based on the S&P/ASX 200 Australia Revenue Exposure Index and S&P/ASX 200 Foreign Revenue Exposure Index,[i] which comprise S&P/ASX 200 companies with high domestic and foreign revenue exposures, respectively, we observed that Australian companies with different revenue exposures had short- and long-term performance divergence historically (see Exhibit 3).

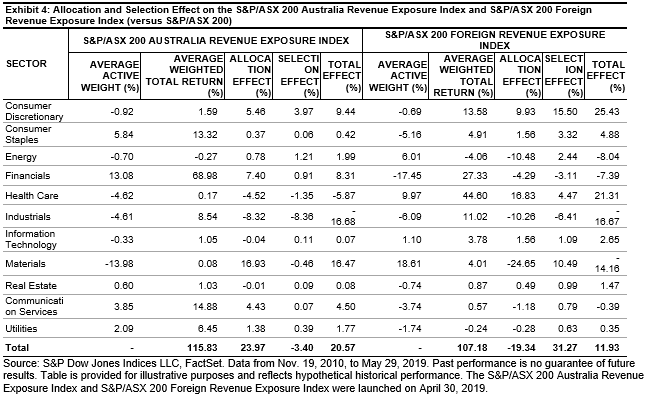
Over the long term, the S&P/ASX 200 Australia Revenue Exposure Index outperformed the S&P/ASX 200 since the index’s inception (November 2010) until January 2016, while the S&P/ASX 200 Foreign Revenue Exposure Index outperformed the S&P/ASX 200 most of the time since February 2016. Based on the return attribution analysis for these two indices relative to the S&P/ASX 200 (see Exhibit 4), the performance differences were not solely explained by sector allocation biases, but also by stock selection within sectors, especially for the S&P/ASX 200 Foreign Revenue Exposure Index.

Compared to the S&P/ASX 200, the S&P/ASX 200 Australia Revenue Exposure Index had the highest active weights in Financials and Consumer Staples and had the largest underweights in Materials, Health Care, and Industrials historically. The total sector allocation bias of the index had a dominating effect on its performance relative to the S&P/ASX 200. The underweight in Materials and overweight in Financials were the major drivers of the index outperformance, while the underweight in Industrials dragged the index returns.

On the other hand, the S&P/ASX 200 Foreign Revenue Exposure Index had the biggest overweight in Materials and Health Care, which had a contrasting impact on the index’s relative return, while the underweight in Financials and Industrials both dragged down the return of the index. Unlike what we observed in the S&P/ASX 200 Australia Revenue Exposure Index, the overall stock selection effect was much more pronounced than the total sector allocation effect in explaining the S&P/ASX 200 Foreign Revenue Exposure Index performance versus the S&P/ASX 200. Stock selections in Consumer Discretionary and Materials were positive contributors to the index’s relative return, indicating that companies with high foreign revenue exposure had performed better than their peers in these two sectors for the overall examined period.

In summary, managing geographical revenue exposures for portfolios resulted in significant performance differences in the Australian equities market and was observed in more than just sector allocation differences. Constructing a portfolio based on quantitative revenue exposure measures is an alternative way for investors to implement their active views on macroeconomic conditions.

[i]   The S&P/ASX 200 Australia Revenue Exposure Index is designed to measure the performance of companies within the S&P/ASX 200 universe with higher-than-average revenue exposure to Australia. Similarly, the S&P/ASX 200 Foreign Revenue Exposure Index is designed to measure the performance of companies within the S&P/ASX 200 universe with higher-than-average revenue exposure to countries, excluding Australia. Index constituents are weighted by the product of float-adjusted market capitalization and targeted geographic revenue exposure percentage, subject to the single stock cap of 10%.


The posts on this blog are opinions, not advice. Please read our Disclaimers.

A Changing Stride for an Ageing Bull

Contributor Image
Chris Bennett

Former Director, Index Investment Strategy

S&P Dow Jones Indices


Taking a cue from Frank Sinatra, the S&P 500® was riding high in April, shot down in May, and got back on top in June.  But the current bull run is feeling its age, and we may be witnessing a change in its stride.  Coming into the end of the quarter (all figures are as of June 25th), here’s my take on the current market drivers.

Notwithstanding a surprise move down in the next couple of days, the S&P 500 looks set to end Q2 with a solid gain after the best June in decades.  However, the rebound from May has not been a typical “risk on” rally.  Concerns over slowing global growth, trade disputes and geopolitical tensions have boosted defensive assets and the fixed income markets are pricing in a sharp loosening in policy on both sides of the Atlantic.

Low Volatility Outperforming Despite Market Gains

The S&P 500 Low Volatility has been a shining star in U.S. equities both this quarter and over the last year.  Including the 100 stocks from the S&P 500 with the lowest 12-month trailing volatility, “Low Vol” does not typically outperform during large market upswings, but when the market declines, Low Vol typically declines by less.  Historically, the benefit of capturing less of the downside and more of the upside has compounded, giving Low Vol a better long-term return despite the decrease in risk.  More recently however, Low Vol has outperformed in the market upturn, which has given an unusually defensive feel to the rally.

Along with the outperformance of Low Vol, the performances of larger and smaller companies (which typically outperform in periods of strong economic gains) also sound a note of caution.  Over the past 12 months, the S&P SmallCap 600® has declined 9%, compared to a gain of 10% in the S&P 500.  Microcaps have struggled even more, underperforming large caps by a whopping 22%.

Trade Winds Blowing

The ongoing trade dispute between China and the United States has been top of the market’s mind for over a year now, and with Presidents Trump and Xi due to meet at the G20 Summit in the final days of June, the potential for a major repricing looks set to accompany us right up until the quarter’s end. (Pity those who will have to wait until the very end of the month to draft their reports!)

But who’s “winning” the trade war?  If we pick the more U.S./China trade-sensitive sectors, namely Industrials, Materials and Information Technology for our indicators, it seems that U.S. companies are having a better time of it than their Chinese counterparts.  So far this quarter, the former have all gained, the latter have all declined (all in USD terms, although a comparison in CNY would draw a similar conclusion).  While few believe that a final deal is imminent, the mood music shifted a bit after U.S. Treasury Secretary Steve Mnuchin said that an agreement was 90% completed.  As ever, the devil still lies in the details.

Europe – Back to the Future?

European bonds and equities and have also jumped this quarter, with both the S&P Europe 350® and the S&P Eurozone Sovereign Bond Index rising 3% quarter-to-date.

Although the European bloc has managed to remain mostly out of the trade crosshairs (at least, for now), economic growth continues to look elusive. While the European Central Bank has long called for fiscal reforms and offered further stimulus if needed, their June meeting seemed to indicate that the second course was the more likely. Broadly speaking, the recent rally has a bit of a nostalgic feel to it: dovish central banks are driving the markets, leading to a “bad news is good news” mindset from investors

But have markets set themselves up for disappointment?  As ‘the bull market that everyone hates’ drags on, it appears that additional stimulus from central banks have already been priced in, leaving policymakers in a precarious position of either giving the market what it expects or leaving it wanting.  While some are waiting for more clarity, it appears others may be shifting into the safety of a shinier haven; the S&P GSCI Gold has soared into the quarter’s end, standing now with a gain of 9% since April.

Request to sign up for our daily market commentary by emailing chris.bennett@spglobal.com

The posts on this blog are opinions, not advice. Please read our Disclaimers.

Dividend Payers Outperform Non-Dividend Payers in Colombia

Contributor Image
Cristopher Anguiano

Senior Analyst, U.S. Equity Indices

S&P Dow Jones Indices

In a previous blog,[1] we explored historical dividend payers in the Colombian equity market, focusing on the S&P Colombia BMI as the underlying universe, highlighting the number of dividend payers, market capitalization, and GICS® sector distribution. Building on that, we now examine if the Colombian market has rewarded dividend payers over non-payers.

As a starting point, we formed hypothetical portfolios by grouping the underlying universe into dividend payers and non-dividend payers. Portfolios are float market cap weighted as well as equal weighted to remove any size bias. Each portfolio rebalances semiannually in March and September. The 10-year back-tested performance shows that both equal-weighted and float market-cap-weighted dividend payer portfolios outperformed non-dividend payers on a cumulative basis (see Exhibit 1).

The risk/return profiles of the hypothetical portfolios (see Exhibit 2) reveal that the dividend payer portfolios outperformed the non-dividend payer portfolios on a risk-adjusted basis. It is worth noting that the realized volatilities of the dividend payer portfolios were lower than the broad market as well as the non-dividend payer portfolios, for equal-weighted and float market-cap-weighted versions. The betas of the dividend payer portfolios were higher than those of non-dividend payers, coming in close to one. Therefore, the dividend payer portfolios were more sensitive to the market.

Similarly, dividend payer portfolios had higher maximum drawdowns than non-dividend payer portfolios. Exhibit 3 shows that the largest drawdowns for non-dividend payer portfolios were similar for both weighting methods. Although the dividend payer portfolios’ peak and trough dates were in line with the market, maximum drawdowns and recovery lengths were larger for capitalization-weighted portfolios.

Next, we looked at the average annual contribution to return over the 10-year period, broken down by sectors (see Exhibit 4). We can see that dividend payer portfolios followed a similar distribution to that of the underlying universe, with Financials being the largest contributor, followed by Utilities and Energy. This result is consistent with our previous blog, where we highlighted that these sectors were the largest contributors to dividend yield. For the Energy sector, which contains only one security, the free-float portfolio contribution was larger than the equal-weighted version.

For the non-dividend payer portfolios, Consumer Discretionary and Materials were the biggest detractors. Financials slightly underperformed and Industrials issues outperformed their dividend payer counterparts, while Consumer Staples had zero contribution, as all the Consumer Staples securities pay dividends. The Utilities and Energy sectors also added positively for all the portfolios, while Communication Services contributed negatively to all portfolios.

Overall, the Colombian equity market has seemed to prefer dividend payers to non-dividend payers. This finding implies that dividend-based strategies are feasible, but market participants may want to address potential sector concentration issues.

[1]   https://www.indexologyblog.com/2019/05/22/examining-dividend-payers-in-colombia/

The posts on this blog are opinions, not advice. Please read our Disclaimers.

The Case for Dividend Futures Contracts

Contributor Image
Tianyin Cheng

Former Senior Director, ESG Indices

S&P Dow Jones Indices

The S&P 500® Dividend Points Index tracks dividend payments of S&P 500 constituents, based on a fixed initial market capitalization, independent of equity price changes. The index cannot be invested in directly, but it is tracked by futures contracts listed on the Chicago Mercantile Exchange (CME). Currently, the annual dividend futures are available up to 10 years forward.

The S&P 500 Dividend Points Index represents cumulative cash dividends paid over a defined period of either one quarter or one year. At the start of the next period, the index is reset to zero so that it reflects dividends paid in discrete periods that coincide with the expiration of S&P 500 futures.

Dividend Futures Use Cases

One important use case of dividend futures (and the OTC swap markets that emerged prior to the futures markets) is dividend risk hedging in structured equity products sold by investment banks, which have been popular in Europe and some Asian countries, such as Korea and Japan.

These products offer equity-linked returns to end clients, although the payouts are usually linked to price changes rather than total returns in the underlying equity index. If a bank hedges with an index futures or basket of equities, they are left with exposure to dividends, which has significant implication on hedging risk.

The dividend futures market enables banks to reduce some of their dividend exposure by selling dividend futures to sophisticated investors. The supply of dividends and the corresponding low demand results in low implied future dividend growth and attracts hedge funds to the dividend market, adding further liquidity and increasing the appeal of dividend transactions. Asset owners may also be willing to buy dividend futures in order to hedge out dividend fluctuation risk in order to better match their liability streams.

How Dividend Futures Work

If a long position in the dividend futures contract is held to expiration, the investment return depends on the difference between the index dividends per share actually paid on the S&P 500 and the price of the dividend futures at the time of the initial investment. The dividend futures price should reflect the market’s best guess as to what the fair value of the future dividends will be, although short-term supply and demand will cause prices to fluctuate around fair value.

According to the dividend discount model, the intrinsic value of a stock equates to the present value of a stock’s future dividends. Therefore, dividend futures prices would generally benefit from stock price increases, especially when looking at a long horizon. In addition, dividend payments tend to be fairly well estimated close to a year before they are paid. Therefore, as the futures get closer to expiry, the futures price sensitivity to stock price decreases (see Exhibit 1).

Dividend Futures versus Estimated Dividend

As of May 31, 2019, the December 2029 S&P 500 Annual Dividend Futures contract priced to 67.4 versus 57.9 for the 2019 contract. This implies a modest 1.5% annualized dividend growth rate over the next 10 years (see Exhibit 2). This growth rate is much lower when compared with the 6% annual dividend growth rate from the past 49 years (from 1970 to 2018).

When we compare the dividend futures prices with forecasted dividends, we can also see a clear gap. The dark blue bar in Exhibit 3 reflects the current dividend futures price; the yellow bars reflect the analyst consensus estimate.

Both the historical dividend growth trend and the dividend estimates seem to indicate that dividend futures are undervalued and may have a 4%-5% upside annually for a buy and hold strategy. One explanation for this “dividend premium” is that banks’ activity creates natural sellers of dividend futures, with a resulting potential return for buyers. Another explanation is the perceived risk of negative dividend surprises. In that sense, the return is simply compensation for risk.

Exhibit 4 demonstrates a buy and hold strategy for the front year dividend futures contract—it longs the next annual dividend futures contract for a year, and when the contract expires, it rolls into the next year’s contract. Such a strategy returned 2.6% per year with a volatility of 2.3% from Dec. 18, 2015, to May 31, 2019.

The posts on this blog are opinions, not advice. Please read our Disclaimers.

Uncertainty’s Curse on Confidence

Contributor Image
Stuart Magrath

Former Senior Director, Channel Management, Australia and New Zealand

S&P Dow Jones Indices

With the dust still settling after the unexpected result of Australia’s recent federal election on May 18, 2019, which resulted in a third 3-year term for the incumbent Liberal-National Party coalition, the Australian government has quickly turned its attention to a slowing in the Australian economy.

While the uncertainty over franking credit refunds and negative gearing on investment properties is over, and despite a recent fillip in residential auction clearance rates, Australia’s unbroken record of 27 recession-free years may still be in danger of being derailed by offshore events. In addition to a keen focus on economic matters, expectations are that the government will quickly turn its focus to legislating the majority of the recommendations from the Royal Commission into Misconduct in the Banking, Superannuation, and Financial Services Industry once the Governor-General opens the 46th Parliament in early July 2019.

For this reason, financial advisers in Australia will likely continue to grapple with major disruption in their industry in 2019 and for the next few years to come. Adding to the Royal Commission outfall, the Financial Adviser Standards and Ethics Authority (FASEA) requirements are now in place for advisers, with the education standards having to be met prior to Jan. 1, 2024.

Despite all these headwinds, many opportunities remain for advisers to transform their practices, and index-based investment solutions could be a vital part of that transformation. We recently published our semiannual Australian Persistence Year-End 2018 Scorecard, and once again, we saw that relatively few active funds were able to stay on top over time. With the results of the SPIVA® Australia Year-End 2018 Scorecard, we can continue to say with confidence that most active managers underperform most of the time.

The latest Australian Persistence Scorecard measured the performance persistence of active funds that outperformed their peers and benchmarks over consecutive three- and five-year periods, and analyzed their transition to other quartiles over subsequent periods. Overall results suggested that only a minority of high-performing funds persisted in outperforming their respective benchmarks, or consistently stayed in their respective top quartiles, over consecutive three- and five-year periods. Among top-quartile funds across all asset classes, 9.7% and 2.2% consistently maintained top-quartile rankings over the consecutive three- and five-year periods, respectively. Top-quartile funds in the Australian Bonds fund category had the lowest turnover over both periods.

With this data, financial advisers could recommend index-linked investment solutions to their clients, explaining that it is difficult to select an active fund that will outperform its relevant benchmark, and that it would be even more difficult to select an active fund that will do so consistently.

The posts on this blog are opinions, not advice. Please read our Disclaimers.