Get Indexology® Blog updates via email.

In This List

How Does Factor-Based Investing Work in the China A Market?

JPX/S&P CAPEX & Human Capital Index: Linking CAPEX and Human Capital to Investment Opportunity

Gearing up for auto tariffs? Revenue exposure might be useful

Are Active Funds Better at Managing Risks? Not Really.

ESG Factors Are Built on Peter Drucker’s Philosophy

How Does Factor-Based Investing Work in the China A Market?

Contributor Image
Liyu Zeng

Director, Global Research & Design

S&P Dow Jones Indices

Factor-based investing has gained popularity in the global investment community. While the long-term risk premia of factors have been evidenced in developed equity markets, some believe the inefficiencies in emerging markets could create better opportunities for factor-based investing.

In our recently published paper, “How Smart Beta Strategies Work in the Chinese Market,” we examined the effectiveness of six well-known equity risk factors—size, value, low volatility, momentum, quality, and dividend—in the China A-share market from July 31, 2006, to Nov. 30, 2018. To reflect the latest market changes, we updated the performance of factor quintile portfolios through April 30, 2019, and observed similar performance across different factors. As shown in Exhibit 1, all factors examined generated positive absolute and risk-adjusted return spreads between their top and bottom quintile portfolios in the China A-share market. Among the six factors, low volatility, value, and small cap were the best-performing factors over the period in absolute and risk-adjusted terms.

Passive investing is a common way to implement factor strategies. Factor indices are usually designed with different indexing techniques such as weighting methods, rebalancing buffers, and diversification constraints to calibrate different levels of factor exposure and portfolio investability.[i]

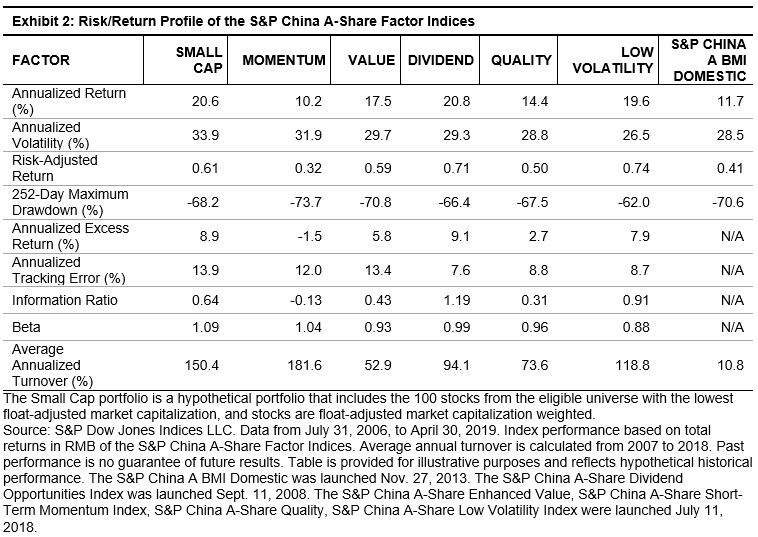
Based on the performance of the S&P China A-Share Factor Indices, all factors except momentum delivered excess returns on an absolute and risk-adjusted basis versus the broad market-cap-weighted benchmark, S&P China A BMI Domestic, (see Exhibit 2). Among various S&P China A-Share Factor Indices, the S&P China A-Share Dividend Opportunities Index and S&P China A-Share Low Volatility Index had the highest risk-adjusted returns and information ratios over the entire examined period. In contrast, the S&P China A-Share Short-Term Momentum Index failed to generate excess returns in the long run.

From a risk perspective, only the S&P China A-Share Low Volatility Index recorded lower volatility and smaller return drawdowns than the S&P China A BMI Domestic, while the S&P China A-Share Short-Term Momentum Index had the most volatile returns.

Although most of the factor indices delivered excess returns in the long run, there were periods of underperformance in the short term. As shown in Exhibit 3, the S&P China A-Share Factor Indices took turns leading and lagging between 2006 and 2019, with return spreads among the best- and worst-performing factors ranging from 12% to 124%. The distinct performance characteristics of factors were seen when we separated factor returns during up and down markets. Momentum and small-cap indices tended to have better performance in up markets, but low volatility, value, quality, and dividend indices performed better in down markets (see Exhibit 4). The distinct cyclicality of factor performance in China could be useful tools for the implementation of active views or exploited by factor-rotation strategies in an attempt to achieve better returns.

[i] All portfolio constituents are drawn from the combined universe of the S&P China A BMI Domestic and S&P China A Venture Enterprises Index, except for the S&P China A-Share Dividend Opportunities Index. To ensure investability, eligible stocks must have a float-adjusted market capitalization no less than RMB 1 billion and a three-month average daily value traded not below RMB 20 million. The S&P China A-Share Enhanced Value Index, S&P China A-Share Short-Term Momentum Index, and S&P China A-Share Quality Index include the 100 stocks with the highest factor scores, and the stocks are weighted by their score-tilted market cap, subject to security and sector constraints. The S&P China A-Share Low Volatility Index includes the 100 stocks with the lowest realized return volatility, and the stocks are weighted by the inverse of volatility. The S&P China A-Share Dividend Opportunities Index includes the 100 stocks from the S&P China A Composite Index with the highest dividend yield, while meeting EPS growth criteria, with all the stocks weighted by their dividend yield. The S&P China A-Share Small Cap portfolio is a hypothetical portfolio that includes 100 stocks with the lowest float-adjust market capitalization, and stocks are weighted by float-adjust market capitalization. All indices were rebalanced semiannually apart from the S&P China A-Share Low Volatility Index, which was rebalanced quarterly.


The posts on this blog are opinions, not advice. Please read our Disclaimers.

JPX/S&P CAPEX & Human Capital Index: Linking CAPEX and Human Capital to Investment Opportunity

Contributor Image
Izzy Wang

Senior Analyst, Factors and Dividends

S&P Dow Jones Indices

Human capital, physical capital, and technology have been widely recognized as a fundamental source of economic growth.[1] Dating back to the 1960s and early 1970s, when we saw a rapid increase in educated workers, facilities, and technological catch-up, Japan’s “economic miracle” emerged along with impressive GDP and per capita output growth.[2] Nowadays, these factors are the core of many countries’ policies to power their economies, including Abenomics’ three arrows. Consequently, one may infer that companies investing in capital expenditure (CAPEX), R&D, and human capital at a higher speed are more likely to generate long-term growth.

For investors, however, looking at the growth of investment in the three drivers alone is not enough. On the corporate level, companies should simultaneously be able to boost labor productivity, increase profitability, and generate returns out of those inputs. In this sense, efficiency is the key to linking these three economic drivers to investors.

The JPX/S&P CAPEX & Human Capital Index is designed to track companies that not only proactively investing in human capital, physical capital, and R&D, but also can demonstrate efficient use of those investments. The index selects the 200 companies with highest composite CAPEX and human capital scores from TOPIX constituents after passing liquidity, creditworthiness, profitability, and beta filters.[3]

CAPEX and R&D

The JPX/S&P CAPEX & Human Capital Index targets companies with a strong growth CAPEX and R&D expenditures. Compared with the broad market, represented by the S&P Japan BMI, the JPX/S&P CAPEX & Human Capital Index steadily maintained a higher CAPEX and R&D expense growth ratio over a five-year period (see Exhibit 1).

Meanwhile, it is crucial for a company to be financially disciplined and undertake worthwhile projects to avoid the pitfall of overinvesting and “empire-building.”[1] The index measures investment efficiency by allocating more weight to companies with a high ratio of revenue to three-year cumulative CAPEX (see Exhibit 2).

Human Capital

The JPX/S&P CAPEX & Human Capital Index utilizes RobecoSAM’s Corporate Sustainability Assessment (CSA) to evaluate three people-related areas: human capital development, talent attraction and retention, and gender equality and human rights. These areas focus on quality activities that can increase productivity, such as employee training, career planning, and equality and respect in the workplace, rather than merely counting the salaries paid to employees as a human capital investment.

The RobecoSAM CSA emphasizes the efficiency of human capital investment by giving a higher score to companies that are able to:

  • Track and report quantitative measures of its training and development programs;
  • Effectively explain the link between its development programs and the impact on its business; and
  • Quantify the economic benefits of its human capital investments and demonstrate higher economic value from these investments over time.

Additionally, companies promoting gender equality are likely to rank higher, and ways they can promote this include having a larger female share of the total workforce and working to lower the wage difference between female and male employees.

In the long run, it is reasonable to believe that companies committed to cultivating, promoting, and protecting their employees could experience higher labor productivity, which in turn, can drive better stock performance.

Performance

The JPX/S&P CAPEX & Human Capital Index outperformed the benchmark TOPIX over 1-, 3-, 5-, and 10-year time horizons in terms of absolute and risked-adjusted returns. Since its launch in 2016, the JPX/S&P CAPEX & Human Capital Index has outperformed the benchmark by 0.86%.

[1] Tang, K (2015). “Considering Capex Efficiency.” S&P Dow Jones Indices.

[1]   Solow, R. M. (1956). A contribution to the theory of economic growth. The quarterly journal of economics, 70(1), 65-94.

[2]   Krugman, P. (1994). The myth of Asia’s miracle. Foreign affairs, 62-78.

[3]   For index construction rules, please refer to the index methodology: https://spindices.com/indices/strategy/jpx-sp-capex-human-capital-index

The posts on this blog are opinions, not advice. Please read our Disclaimers.

Gearing up for auto tariffs? Revenue exposure might be useful

Contributor Image
Hamish Preston

Head of U.S. Equities

S&P Dow Jones Indices

May was categorized by the return of macro fears.  Many equities indices and fixed income indicators flashed red – and the S&P 500’s four month win streak ended – as investors grappled with trade tensions and the potential impact on global growth.  Adding to investors’ uncertainty, President Trump’s surprise month-end announcement of tariffs on Mexican goods raised fears that besides China, the U.S. may target other countries with which it has a large trade deficit, especially Japan and Germany (see Exhibit 1).

The perceived prospect of tariff contagion weighed on Japanese and German equities last month – the S&P Japan BMI (-6.5%) and the S&P Germany BMI (-5.6%) both fell in local currency terms.  Against that background, we look at the potential impact of auto tariffs on car manufacturers in both countries.  In Exhibit 2, we approximate that impact by comparing the U.S. revenue exposure of the Japanese and German Automobiles and Components industry groups.

Quite clearly, both industry groups have greater U.S. revenue exposure than their underlying broad-based indices, which may help to explain their performance in May: the S&P Japan BMI Automobiles and Components and the S&P Germany BMI Automobiles and Components indices plunged 10.9% and 13.0%, respectively, in local currency terms.

As with our previous studies on Brexit, the USMCA trade deal, and the 2016 U.S. Presidential election, understanding the geographic revenue exposures of various market segments can help to explain market performance.  And should the recent flashes of red on many of our dashboards persist due to trade tensions, geographic revenue data may become even more important in offering market insights.


The posts on this blog are opinions, not advice. Please read our Disclaimers.

Are Active Funds Better at Managing Risks? Not Really.

Contributor Image
Berlinda Liu

Former Director, Multi-Asset Indices

S&P Dow Jones Indices

In investing, risk and return are two sides of the same coin; the expected returns of an asset must be accompanied by variation or uncertainty around the outcome of those returns. All else equal, higher-risk assets should be compensated, on average, by higher returns. The same philosophy applies to performance evaluation. The performance of both active and passive funds should be evaluated in proportion to the risks taken to achieve those returns.

Our Risk-Adjusted SPIVA® Scorecard examines the performance of actively managed funds against their benchmarks on a risk-adjusted basis, using both net-of-fees and gross-of-fees returns. We used the standard deviation of monthly returns over a given period to define and measure risk. The return/risk ratio looks at the relationship and the trade-off between risk and return. All else equal, a fund with a higher ratio is preferable since it delivers a higher return per unit of risk taken. To make our comparison relevant, we also adjusted the returns of the benchmarks used in our analysis by their volatility.

After adjusting for risk, the majority of actively managed domestic funds in all categories underperformed their benchmarks, net-of-fees, over mid- and long-term investment horizons. Although the risk-adjusted performance of active funds improved compared to their benchmarks on a gross-of-fees basis, real estate was the only fund category that generated a higher ratio than the benchmark over the five-year period. Overall, the majority of active domestic equity managers in most categories underperformed their benchmarks on a gross-of-fees basis.

Asset-weighted return/risk ratios of active managers were higher than their equal-weighted counterparts, indicating that larger firms tend to take on better compensated risk than smaller firms (see Exhibit 2). When comparing average ratios against their benchmarks, all domestic equity categories had lower ratios across all investment horizons when they were equally weighted on a net-of-fees basis. However, asset-weighted ratios of real estate funds (over the 5-, 10- and, 15-year periods), large-cap value funds (over the 10- and 15-year periods), mid-cap growth funds (over the 5-year period), and mid-cap value funds (over the 10-year period) were higher than the benchmarks.

The impact of fees on active managers’ risk-adjusted returns was substantial. For example, on a gross-of-fees basis, the asset-weighted average return/risk ratios of all large-cap funds exceeded the benchmarks across all investment horizons. However, the advantage diminished quickly when fees were taken into consideration (see Exhibit 3).


Our analysis dispels the myth that active management possesses better risk-management skills than passive indices. Moreover, any perceived advantage in higher risk-adjusted returns quickly disappears once fees are accounted for.

For more information on the risk-adjusted performance of actively managed funds compared with their benchmarks in 2018, read our latest Risk-Adjusted SPIVA Scorecard.

The posts on this blog are opinions, not advice. Please read our Disclaimers.

ESG Factors Are Built on Peter Drucker’s Philosophy

Contributor Image
Zachary First

Executive Director

Drucker Institute, Claremont Graduate University

Do you ever wonder where environmental, social, and governance (ESG) factors—now used in more than 25%[1] of all assets under management—come from? The short answer is: Mainly from the good-practices checklists maintained by a handful of big ratings agencies.

But where did those agencies get their checklists? Mainly from the fruits of a handful of turn-of-the-millennium sources, including John Elkington’s “Triple Bottom Line,” the “100 Best Companies to Work For” list, and the United Nations Principles for Responsible Investment.

But where did these sources come from?

Sixty-five years ago, Peter Drucker wrote in his landmark book, The Practice of Management, “What is most important is that management realize that it must consider the impact of every business policy and business action upon society.”

While Drucker would have applauded the rise of ESG investing, he would have encouraged it as one piece of a broader, holistic view of “social responsibility.” For Drucker, social responsibility begins with the customer. After all, he wrote, “it is to supply the consumer that society entrusts wealth-producing resources to the business enterprise.” Drucker also held that a corporation must take care of its employees, maintaining that if “worker and work are mismanaged” it is “actually destructive of capital.” He counseled that companies must constantly pursue innovation, not merely to grow revenue but in service of their basic function as society’s “specific organ of growth, expansion and change.” In all of this, Drucker was decades ahead of his time, anticipating an age in which 80% of a company’s value[2] would take the form of intangibles not shown on a balance sheet.

Not that Drucker considered financial strength unimportant. Business’s “first responsibility,” Drucker declared, “is to operate at a profit,” so as to fulfill its role as “the wealth-creating and wealth-producing organ of our society.” Ultimately, Drucker saw that social responsibility would be the highest expression of business purpose rather than a feel-good sideshow—a harbinger of today’s concept of “shared value” and the basis of the S&P/Drucker Institute Corporate Effectiveness Index. “It is management’s…responsibility,” Drucker wrote, “to make whatever is genuinely in the public good become the enterprise’s own self-interest.”

The evidence that investors and executives are still catching up to Drucker’s foresight is, sadly, all around. Pleas to fix capitalism before it breaks beyond repair aren’t only coming from dissatisfied workers and customers or political ideologues; they’re coming from the power elite at Davos and the Milken Institute.[3]

Here again, we find ESG’s roots in Drucker’s philosophy. Sixty-five years before today’s headlines about worried billionaires, Drucker wrote, “capitalism is being attacked not because it is inefficient or misgoverned but because it is cynical. And indeed, a society based on the assertion that private vices become public benefits cannot endure, no matter how impeccable its logic, no matter how great its benefits.”

The rising concern for capitalism’s social viability comes alongside booms in both ESG investing and ESG products and services. That’s no accident. In Peter Drucker, we have the same person to thank for laying ESG’s foundation, sounding the alarm about its importance, and prescribing it as a solution.

[1]   Bernow, Sara, Klempner, Bryce, and Magnin, Clarisse. “From ‘why’ to ‘why not’: Sustainable investing as the new normal.” McKinsey & Company. October 2017.

[2]   EY – The Embankment Project for Inclusive Capitalism Report.

[3]   Jaffe, Greg. “Capitalism in crisis: U.S. billionaires worry about the survival of the system that made them rich.” The Washington Post. April 20, 2019.

The posts on this blog are opinions, not advice. Please read our Disclaimers.