The so-called “Brexit” referendum result in the UK on June 23, 2016, came as a shock to financial markets, with the S&P United Kingdom LargeMidCap (GBP) falling by over 3% the following day. As the political and economic outlook became uncertain, the British pound sterling had steep declines against other major currencies including the U.S. dollar (-8%), the euro (-6%), and the yen (-11%).[1] Not surprisingly, many companies in the index fell in price, as nearly 30% of constituents declined by 10% or more. However, it was interesting to note that despite the overall market declining, some constituents actually rose, including 8 of the top 10 companies in terms of market capitalization.
Was there an underlying theme as to why certain companies did well when the overall market precipitously declined? To investigate this, we first look at the average stock return on June 24, 2016, within each sector for any potential insight (see Exhibit 1). With a general understanding of the commercial characteristics of each sector, it becomes quite clear—sectors that had significant revenue outside of the UK performed relatively better than sectors with substantial domestic revenue.
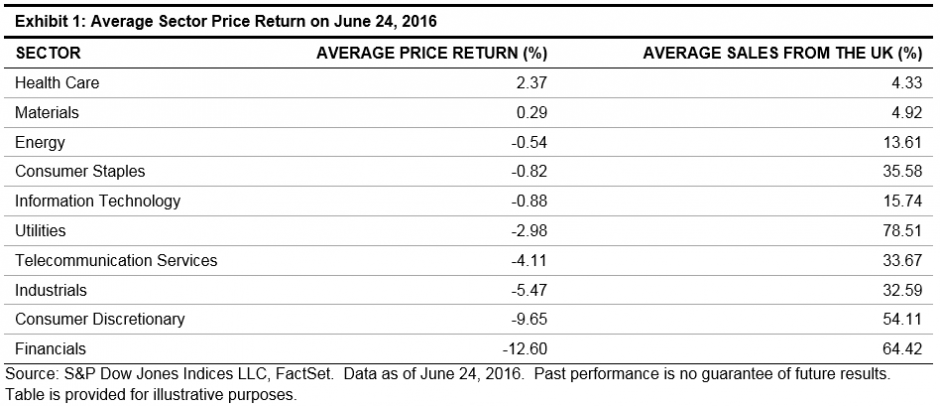
Several underlying reasons could have a played role in the high dispersion of returns. First, the higher uncertainty of the future outlook of the UK economy could understandably affect companies with high domestic revenues compared to companies with more diversified and/or foreign sources of revenue by geographic region. Secondly, the drop in the British pound sterling relative to other global currencies could benefit companies with high foreign revenues, as sales in foreign markets are typically completed in foreign currency. As companies translate foreign revenues back into a domestically weaker currency, these revenues would be worth more in local currency terms than originally expected (note: this is with an assumption that the company did not employ currency hedging practices).
To investigate the hypothesis further, we formed two hypothetical portfolios, grouped based on the percentage of revenue coming from domestic versus foreign sources, using the S&P United Kingdom LargeMidCap as the underlying universe. Available geographic revenue data was aggregated for all constituents in the index, and then the universe was separated into quartiles based on each company’s percentage of sales coming from the UK. The top quartile, which comprised the companies with highest domestic revenues, were compiled into a “domestic revenue” portfolio and the bottom quartile compiled into a “foreign revenue” portfolio. The portfolios were weighted by each company’s percent of revenue to the targeted geographic area; for the domestic revenue portfolio, companies with the highest revenue exposure to the UK had the highest weights, and for the foreign revenue portfolio, companies with the highest foreign revenue exposure had the highest weights.
To understand how the resulting geographic revenue distribution differed among both portfolios and the benchmark, Exhibit 2 breaks down the weighted average sales percentages in several categories.
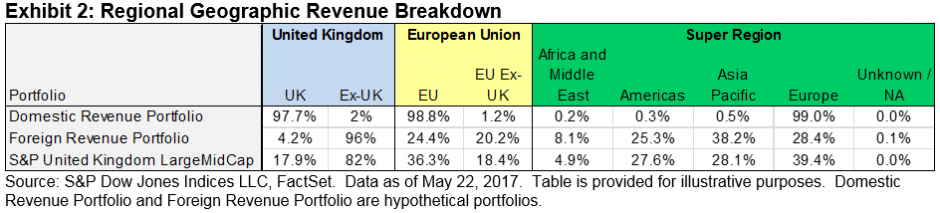
The benchmark, composed of only UK-domiciled companies, had total revenues from the UK of just 18%. The hypothetical portfolios showed a stark contrast in the resulting revenue sources, with the domestic portfolio having 98% exposure to the UK and the foreign portfolio with just 4% of revenue coming from the UK.
We tested to see how the three portfolios have performed since the Brexit vote (see Exhibit 3).
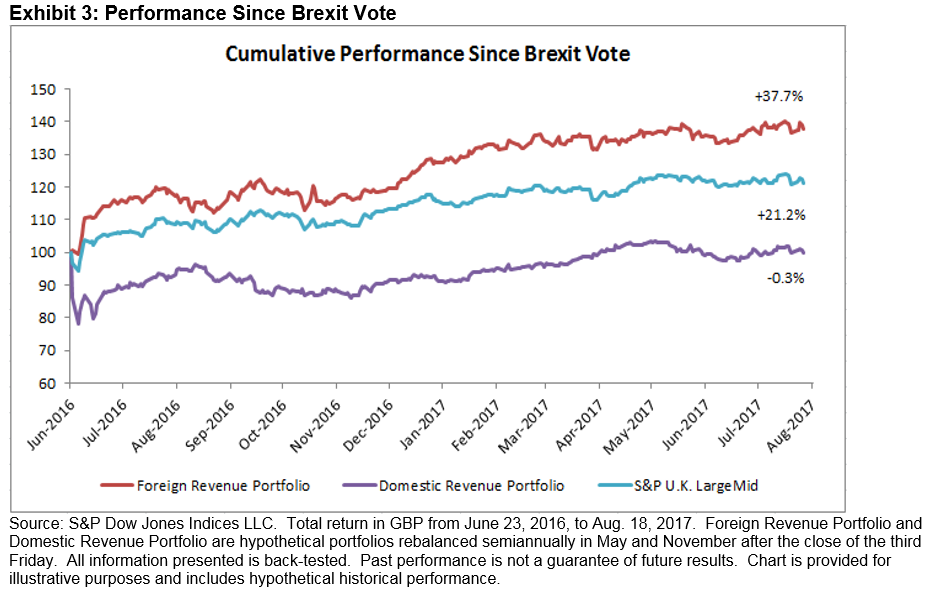
We can see that there has been a significant difference in performance between the domestic and foreign revenue portfolios since Brexit, with the former outperforming the latter by 38%. Furthermore, the foreign revenue portfolio also outperformed the broad-based UK market during the same period. The findings highlight the importance of incorporating geographic revenue information into a strategy, in particular if market participants wish to express their views on geographically driven thematic events.
[1] Source: FactSet. Rounded percentage change of mid-quote for each currency pair on June 24, 2016.
The posts on this blog are opinions, not advice. Please read our Disclaimers.