Get Indexology® Blog updates via email.

In This List

New Additions to the S&P 500® Dividend Aristocrats® Class of 2019

Access the S&P 500 with Built-in Buffers

The Height of the Hurdle

2018 SPIVA® Scorecard: Volatility Does Not Help Active Performance

When to Get Active with Sectors

New Additions to the S&P 500® Dividend Aristocrats® Class of 2019

Contributor Image
Smita Chirputkar

Former Director, Global Research & Design

S&P Dow Jones Indices

The December 2018 rebalance of the S&P 500 Dividend Aristocrats added four new companies, with the changes effective at the open of Feb. 1, 2019. The new firms are Caterpillar Inc., Chubb Limited, People’s United Financial Inc., and United Technologies Corp. These four companies have the distinguishing characteristics that allow them to be eligible for inclusion in the S&P 500 Dividend Aristocrats.

The S&P 500 Dividend Aristocrats is designed to measure the performance of S&P 500 constituents that have a record of increasing dividends every year for at least the past 25 consecutive years. The index now comprises 57 securities.

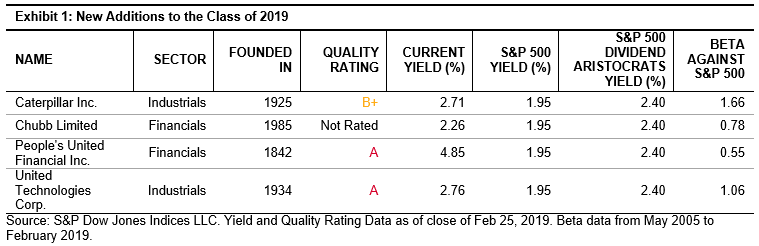
Exhibit 1 compares these firms’ characteristics to both the S&P 500 and S&P 500 Dividend Aristocrats. The S&P 500 Dividend Aristocrats historically reflected higher yields than the S&P 500. The newly added members also displayed the same higher yield characteristics as of the close of Feb. 25, 2019.

On average, the S&P 500 Dividend Aristocrats is less volatile than the S&P 500, as exhibited by a beta of 0.8.[1] Two of the newly added members displayed a similar trend of lower beta compared to the S&P 500 (during an analysis period from May 2005 to February 2019).

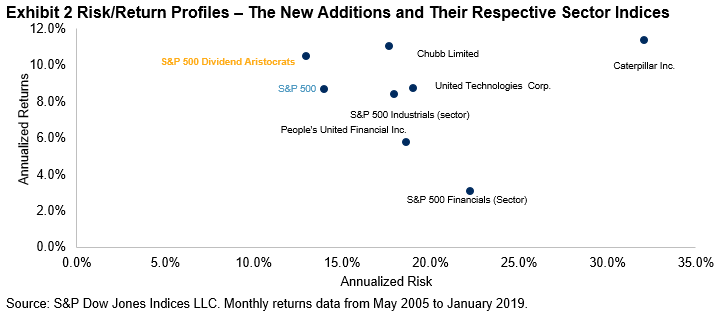
To see how the newly added securities stack up against their respective sectors, we looked at their risk/return characteristics over the period from May 2005 to January 2019 (see Exhibit 2). Historically, the S&P 500 Dividend Aristocrats outperformed the S&P 500 with lower volatility, as shown by the higher Sharpe ratios, regardless of the time horizon being measured.[2] The newly added Financials stocks showed higher Sharpe ratios than the sector index, the S&P 500 Financials, while the newly added Industrials stocks showed Sharpe ratios similar to that of the S&P 500 Industrials.

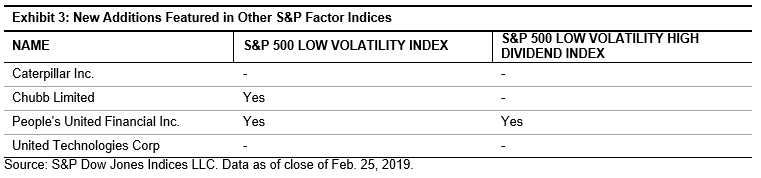
Our previous study shows that the S&P 500 Dividend Aristocrats outperformed the S&P 500 about 71% of the time when the benchmark was down[3] (during an analysis period from Jan. 31, 1990, to Dec. 31, 2018). In this context, we looked to see if the new constituents were also featured in other factor indices such as the S&P 500 Low Volatility Index and the S&P 500 Low Volatility High Dividend Index. As shown in Exhibit 3, two of the four newly added members have also exhibited low volatility along with high dividend yield characteristics, and they are a part of the respective S&P Factor Indices.

Conclusion

The addition of 4 new members brings the number of securities in the S&P 500 Dividend Aristocrats to 57. Of the new additions, 3 are well-established companies, each with over 75 years of corporate history. The newly added constituents have shown trends of higher dividend yields similar to the other constituents of the S&P 500 Dividend Aristocrats. The new members have also provided Sharpe ratios higher than or similar to their corresponding S&P 500 sector indices during the analysis period.

[1] Soe, Aye and Chirputkar, Smita, “A Fundamental Look at S&P 500 Dividend Aristocrats,” S&P DJI.

[2] Soe, Aye and Chirputkar, Smita, “A Fundamental Look at S&P 500 Dividend Aristocrats,” S&P DJI.

[3] Soe, Aye and Chirputkar, Smita, “A Fundamental Look at S&P 500 Dividend Aristocrats,” S&P DJI.


The posts on this blog are opinions, not advice. Please read our Disclaimers.

Access the S&P 500 with Built-in Buffers

Contributor Image
Matt Kaufman

Principal and Senior Director, Head of Distribution and Product Development

Milliman Financial Risk Management LLC

Earlier in 2018 S&P Dow Jones Indices, Cboe Global Marketssm, and Milliman Financial Risk Management LLC collaborated to build four new series of Target Outcome Indexes, designed to reflect defined exposures to the S&P 500 Index, where the downside protection levels, upside growth potential, enhancement level, and outcome period are all pre-determined.

Each Series consists of four quarterly issued indexes (January, April, July, and October—16 indexes total) that reset annually.

Buffer Protect Series

Cboe S&P 500 15% BUFFER PROTECT INDEX SERIES

  • SPRF-01 (January), SPRF-04 (April), SPRF-07 (July), SPRF-10 (October)

Cboe S&P 500 30% (-5% TO -35%) BUFFER PROTECT INDEX SERIES

  • SPRF-01 (January), SPRF-04 (April), SPRF-07 (July), SPRF-10 (October)

Enhanced Series

Cboe S&P 500 3X UP, 1X DOWN ENHANCED GROWTH INDEX SERIES

  • SPEG-01 (January), SPEG-04 (April), SPEG-07 (July), SPEG-10 (October)

Cboe S&P 500 2X UP, 1X DOWN, 10% BUFFER PROTECT INDEX SERIES

  • SPEB-01 (January), SPEB-04 (April), SPEB-07 (July), SPEB-10 (October)

Solving a Key Challenge: Providing Simple Access to Structured Outcomes

The approach taken by the Target Outcome Indexes is analogous to certain equity-linked strategies used in structured products and structured annuities—a space with nearly $1 trillion in combined assets in the U.S. alone. As large as the structured product space has become, it has historically been accessed by institutional and high net worth investors, and has been largely ignored by retail investors, the financial press, and product developers.

We surmise one key reason for this is that the structured product space has never truly addressed one of its biggest challenges regarding the investing public, which is to devise a simple and transparent approach that investors could easily access and follow.

In our view, solving this challenge through an index based approach can provide unprecedented access to structured outcomes for institutional investors and financial advisors, and establishes liquidity and transparency within an otherwise complex and opaque space.

Cboe Target Outcome Indexes were built to replicate features of the largest structured product category, which are tied to the return of an underlying equity asset, like the S&P 500 Index.

Creating Defined Exposures to the S&P 500

Each Cboe S&P 500 Target Outcome Index seeks to reflect defined exposure to the S&P 500 Price Index (S&P 500) through four parameters:

Defined Parameters of Target Outcome Indexes

  1. Equity Market Exposure: S&P 500 Index. Target Outcome Indexes reflect exposure to broad equity markets on which there are liquid underlying derivatives markets; in this case the S&P 500—a broad measure of U.S. large cap equities.
  2. Defined Downside Protection Levels: 0%, 10%, 15%, 30%. Target Outcome Indexes seek to incorporate defined levels of downside protection (e.g., 0%, 10%, 15%, and 30%) over each Index’s outcome period. For example, if at the end of the outcome period the S&P 500 is down 20%, it is expected that a target outcome strategy with a 15% protection level would be down 5%. Note: the Cboe S&P 500 30% (-5% to -35%) Buffer Protect Index seeks to provide a 30% buffer from -5% to -35%, exposing investors to the first 5% of losses relative to the S&P 500.
  3. Defined Upside Growth Potential: 1x, 2x, 3x to a cap. Cboe Target Outcome Indexes seek to incorporate upside growth relative to the S&P 500, to a cap. Each Index also exhibits an upside participation rate, which is an enhancement factor that represents the amount of upside exposure the index return is multiplied by, over the outcome period and subject to a cap. The upside growth is either 1x (no enhancement), 2x, or 3x. The enhancement factor is only applied to the upside growth of the Index. Downside exposure is on a one-to-one basis, over the outcome period (not accounting for any protection levels).
  4. Defined Outcome Period: One Year. Cboe Target Outcome Indexes seek to reflect target outcomes over a one-year outcome period, at which point each Index resets (i.e., “rolls”). Investors may be familiar with certain investment products that seek to deliver both upside and downside exposure (often leveraged) to an asset over a daily or weekly point-to-point period. The Cboe Target Outcome Indexes seek to incorporate upside enhancement and/downside protection levels on an annual point-to-point period.

The Index methodology sets the equity market exposure, downside protection level, upside enhancement level, and outcome period for the life of each Index. The upside cap is established at the beginning of each outcome period.

The posts on this blog are opinions, not advice. Please read our Disclaimers.

The Height of the Hurdle

Contributor Image
Anu Ganti

U.S. Head of Index Investment Strategy

S&P Dow Jones Indices

Indexing provides many rewards, including a reduction in volatility. Asset owners should demand higher returns to justify the volatility that active management entails. For managers who put their stock selection skills to the test, it is worth understanding the height of the volatility hurdle in managing a portfolio’s risk/return profile.

We can illustrate this by considering the volatility of a sector index, which, like that of any portfolio, is contingent upon the weights, volatilities, and correlations of its constituents. In particular, the lower the correlations, the greater the reduction in volatility between the constituents and the portfolio will be. Exhibit 1 illustrates this for the S&P 500® and its 11 component sectors. The S&P 500 is 45% less volatile than its constituent stocks, while the average sector index reduces component volatility by 30%. This effect is more pronounced in certain sectors, such as Consumer Discretionary, Consumer Staples, and Health Care, which have relatively low within-sector correlations.

A portfolio manager can own an entire sector or, alternatively, own only a small number of her favorite stocks. Buying individual stocks typically requires assuming more volatility, which implies an expectation of higher returns. But how much higher? Consider: the Utilities sector historically returned 7.8% annually, which implies 0.50 units of return for every unit of risk. The average Utilities stock is more volatile (22.1%) than the sector as a whole (15.6%). To maintain a constant 0.50 return/risk ratio, the average stock would need to return 3.3% more than the sector as a whole. Exhibit 2 applies this logic to the S&P 500 and to each individual sector.

The required incremental return is greatest in Consumer Discretionary, Consumer Staples, and Health Care, all of which have below-average within-sector correlations. At the other extreme lies Real Estate, where within-sector correlations are quite high.

How likely is it that the required returns from Exhibit 2 are actually attainable? Dispersion, or the spread among returns in a sector, indicates how challenging it might be for managers to generate this incremental return. For the Utilities sector, the 3.3% incremental return amounts to 0.21 “dispersion units” (or, roughly speaking, a stock return 0.21 standard deviations above the sector mean).

Exhibit 3 makes this comparison for all sectors. Consumer Staples and Health Care stand out as particularly challenging. In these sectors, fewer stocks will generate the return sufficient to justify a concentrated position.

Stock selection within sectors entails the possibility of higher returns, but the probability of higher volatility. This framework helps understand within which sectors that incremental volatility is most likely to be justified.

The posts on this blog are opinions, not advice. Please read our Disclaimers.

2018 SPIVA® Scorecard: Volatility Does Not Help Active Performance

Contributor Image
Berlinda Liu

Former Director, Multi-Asset Indices

S&P Dow Jones Indices

Contrary to the myth that active managers tend to fare better than their benchmarks during volatile markets, 68.83% of domestic equity funds lagged the S&P Composite 1500® during the one-year period ending Dec. 31, 2018, making 2018 the fourth-worst year for active U.S. equity managers since 2001 (see Exhibit 1).

Evidence from the SPIVA U.S. Year-End 2018 Scorecard puts a question mark over the ability of active managers to generate alpha during market turmoil. In 2018, heightened volatility accompanied by below-average dispersion might have handcuffed active managers in terms of stock picking, and the investment outcome in general seemed more random than usual, as indicated by a relatively large standard deviation of return distribution.

Last year was a rollercoaster ride for financial markets (see Exhibit 2). The S&P 500® (-4.38%) finished 2018 with its first calendar-year loss in a decade, while the S&P MidCap 400® (-11.08%) and the S&P SmallCap 600® (-8.48%) posted even larger losses. Despite elevated volatility levels in 2018, monthly dispersion—the difference between winners and losers—of the S&P 500 remained generally below its long-term average since 2009 (see Exhibit 3). The combination of high volatility and low dispersion in 2018 created a challenge for active managers to generate alpha through stock selection.

Outcomes from active investment decisions in 2018’s market conditions seemed more random than usual. The one-year return distribution of all U.S. large-cap funds showed higher standard deviation compared with medium- and long-term distributions (see Exhibit 4).

For the ninth consecutive year, the majority (64.49%) of large-cap funds underperformed the S&P 500. Similarly, small-cap equity managers found it more challenging to navigate 2018’s market environment compared with 2017’s range-bound market movements; 68.45% of all small-cap funds lagged the S&P SmallCap 600 over the one-year horizon. Mid-cap mutual funds fared better; for the second consecutive year, the majority (54.36%) beat the S&P MidCap 400. Over the fifteen-year investment horizon, however, 80% or more of active managers across all categories underperformed their respective benchmarks.

The posts on this blog are opinions, not advice. Please read our Disclaimers.

When to Get Active with Sectors

Contributor Image
Tim Edwards

Managing Director, Index Investment Strategy

S&P Dow Jones Indices

When do sectors matter, and what can you do about it?  Sometimes the sector composition of an equity portfolio strongly affects its returns.  At other times, single stock effects or overall market effects dominate.

Sector-based products such as ETFs and futures have been around for decades, but recently they have attracted growing interest.  Exhibit 1 illustrates the increase in open interest and volumes in products linked to S&P DJI’s U.S. sector and industry indices since 2013.  Both series show a more-than-doubling of investor usage in the past six years.

Exhibit 1: Growing Usage in Products Linked to Sector Indices

This growth might be attributed to a wider trend toward index-based investing in the general market, particularly by financial advisors.  However, the growth in trading volume handily exceeds the growth of assets under management, which suggests an alternative user base to the traditional “buy and hold” mentality of passive investors.  Active investors might be hedging the sector exposures of their single-stock picks, or they might be making direct bets on the relative fortunes of sectors.  In either case, they seem to be doing more of it than they used to do. 

Why now?  The answer is that the strength of sectoral effects in equities has increased.

We discuss this in depth in our recently published paper, Sector Effects in the S&P 500®, which outlines a method to measure the relative importance of sectors in determining the risks and performance of constituents.  The result of this analysis is shown in Exhibit 2.  When the series of Exhibit 2 rises, it tells us that a stock’s sector membership is of growing importance, relative to its market (S&P 500) membership.  When the series declines, sector effects are less important in driving returns.

Exhibit 2: Sector Importance Has Risen Significantly Since 2013

The rising trend of the series in the past six years offers one explanation for the rising usage of sector-based products, which naturally find greater application when sectoral exposures are more dominant in determining outcomes.

The relative importance of sectors has important applications for effective active management in single stocks, as well as offering a perspective on the extent to which “macro” concerns are driving returns.  For a useful in-depth understanding these sectoral trends, have a read of the paper.  Or to simply monitor the ongoing dynamics of Exhibit 2, follow our monthly sector dashboards for updates.


The posts on this blog are opinions, not advice. Please read our Disclaimers.