Get Indexology® Blog updates via email.

In This List

Innovation in Indexing: Incorporating Options in Indexes to Help Achieve Defined Investment Outcome as a Packaged Solution

Index Investing – The Growing Mantra

Latin American Scorecard: Q1 2018

Exploring the G in ESG: The Relationship Between Good Corporate Governance and Stock Performance – Part 2

Water Risk: Looking Back and Looking Ahead

Innovation in Indexing: Incorporating Options in Indexes to Help Achieve Defined Investment Outcome as a Packaged Solution

Contributor Image
Berlinda Liu

Former Director, Multi-Asset Indices

S&P Dow Jones Indices

For decades, sophisticated institutional investors have been using combinations of options to achieve desired investment outcomes or specific payoff structures. With innovations in indexing, it is now possible to gain passive exposure to those predefined outcome goals. Before we begin to explore how those index strategies are constructed and how such access may be possible, it may be worthwhile to take a refresher on basic options.

The basic building blocks of option strategies are puts and calls. Since a call option gives an investor the right, but not the obligation, to buy an underlying security at a specified price (strike) within a specific time period, a call buyer may exercise the call and benefit when the underlying security goes above the option strike before the call expires. Conversely, a put option gives an investor the right, but not the obligation, to sell an underlying security at a specified price (strike) within a specific time period, therefore a buyer of a put may exercise the put and benefit when the underlying security goes below the option strike. In exchange of the potential benefit, an option buyer pays a premium upfront to the seller. On the other side of the trade, an option seller collects the premium as a compensation for potential loss by option expiration.

Exhibit 1 shows the payoff diagrams of the buyer and seller of an option contract.

Using the simple building blocks illustrated above, we will demonstrate how a hypothetical, complicated defined payoff may be achieved.

For example, a call spread can be constructed with a long call (at strike K1) that offers upside growth and a short call at a higher strike (K2). This structure is widely used in a range-bound or moderate bull market as a cost-efficient alternative to a long position in the underlying security. By the option expiration day, if the underlying security falls below K1, the call spread should have no loss other than the upfront net premium paid; if the underlying security rises above K1 and below K2, the call spread should offer 1:1 upside growth; when the underlying security rises above K2, the call spread return is capped. Exhibit 2 shows the payoff of a typical call spread with K1 = 100 and K2 = 120.

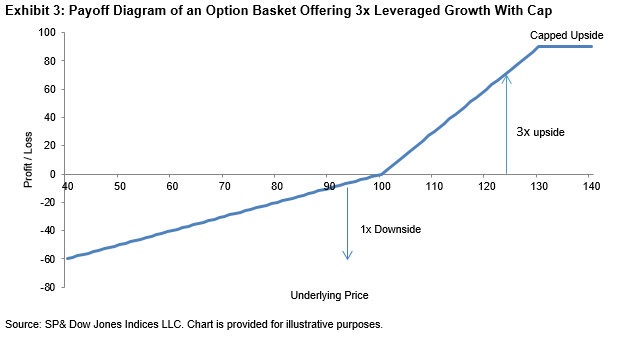
Using multiple option positions, we can further demonstrate a complex strategy to target specific outcomes, such as a strategy wishing to participate up to 3x of upside (with a cap) while limiting downside losses to only 1x (assuming the underlying security price is 100).

Now, the question is how does an investor achieve this payoff? A basket of options is used to construct this hypothetical portfolio.

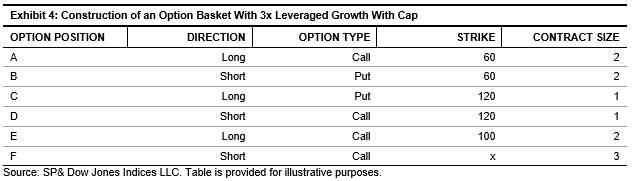
Put-Call Parity theorizes that A and B are equivalent to a 2x leveraged, long-forward contract at strike 60 while C and D are equivalent to a short-forward contract at strike 120. The net effect of these four options is a net long-forward contract and a 1:1 exposure to the upside and downside. E offers another 2x exposure to the upside. Therefore, the basket offers 3x upside and 1x downside to the underlying security. The strategy also writes three call options F at a higher strike (x), which brings the cost of the option basket equal to a direct investment in the underlying security and the upside should be capped at x, consequently.

This example shows that using options to help achieve desired payoff can be a complicated tool. This is the main reason why these strategies have long been limited to OTC trading as bespoke solutions. Now, CBOE and S&P Dow Jones Indices have introduced a suite of benchmark indices that are designed to track the performance of some widely used target outcome strategies. One example is the CBOE S&P 500 3x Up, 1x Down Enhanced Growth Index Series, which seeks to offer the payoff as seen in Exhibit 3.

With these index-based defined outcome solutions, market participants can target precise payoff as they wish.

S&P® is a registered trademark of Standard & Poor’s Financial Services LLC. Cboe® is a registered trademark of Cboe, Inc. S&P Dow Jones Indices LLC does not sponsor, endorse, market or promote investment products based on its indices and will have no liability with respect thereto.

The posts on this blog are opinions, not advice. Please read our Disclaimers.

Index Investing – The Growing Mantra

Contributor Image
Koel Ghosh

Former Head of South Asia

S&P Dow Jones Indices

The growth rate of the Indian passive investing space has been impressive. Though it’s still early days for this market, the statistics are clear. At year-end 2017, Indian ETF assets stood at INR 78,000 crores (USD 12 billion), with an annualized growth rate of 76.6% over the past four years.1 For India, the passive investing space gained popularity, with a good deal of interest in gold ETFs, but in the past few years, interest has shifted to equity ETFs, which have gained prominence. This trend was supported by Indian government initiatives that provided the necessary boost, with the Central Public Sector Enterprises (CPSE) ETF and by the Employees’ Provident Fund Organisation (EPFO) investments allocated to equity ETFs.

However, for a nascent market like India, the preference is for the market benchmarks and size and sector plays. For example, the S&P BSE SENSEX, S&P BSE SENSEX 50, and S&P BSE 100 are indices that seek to represent Indian market dynamics and can be selected for indexed solutions. The markets are clearly indicating signs of a growing acceptance of passive investing. So what is it that is working for indexing?

Lower Cost

Lower cost is an important contributor. Passive investing eliminates the active manager’s costs for trading, research, management fees, etc. To get a better understanding, Exhibit 1 shows the expense ratio limit for asset management companies.

Exhibit 1: Expense Ratio of Asset Management Companies
AVERAGE WEEKLY NET ASSETS LIMIT APPLICABLE ON EQUITY SCHEMES (%) LIMIT APPLICABLE ON DEBT SCHEMES (%)
First INR 100 Crores 2.50 2.25
Subsequent INR 300 Crores 2.25 2.00
Subsequent INR 300 Crores 2.00 1.75
On the Balance Assets 1.75 1.50

Source: S&P Dow Jones Indices LLC. Data as of Dec. 31. 2017. Table is provided for illustrative purposes.

An additional 30 bps can be charged if 30% of new inflows or 15% of existing assets are from cities outside the top 15.

In comparison, current ETFs in India are operating at much lower costs. Some of the lower expense ratios vary from 5 bps (which is 0.05%) to as low as 0.9 bps (0.009%) in the case of the S&P BSE BHARAT 22 Index ETF.

This 2% difference in cost (and more in some cases) offers a strong case for passive investing. The growing popularity of passive options has the potential to offer cost-effective solutions to market participants.

Exhibit 2: Expense Ratio of ETFs in India 


Source: Bloomberg L.P. Data as of Feb. 15, 2018. Table is provided for illustrative purposes.

Benchmark Performance Over Active Management

While India is still largely an active-investment space, the dynamics are changing. Our SPIVA® India report has been outlining the same conclusion. Considering the large-cap and mid/small-cap segments as a sample, the shift is evident since 2016, when the outperformance of the benchmark over active funds was significant and continuous in the one-year period. Over the long term (i.e., five and ten years), the outperformance was consistent. A similar outperformance trend was observed in the fixed income segment covered in the India SPIVA reports. This is a good lesson about long-term investment strategy; the empirical evidence suggests that index investing is a good option.

Exhibit 3: SPIVA India Reports – Percentage of Funds Outperformed by the Index
YEAR FUND CATEGORY COMPARISON INDEX ONE-YEAR (%) THREE-YEAR (%) FIVE-YEAR (%) TEN-YEAR (%)
Year-End 2013 Indian Equity Large-Cap S&P BSE 100 78.53 66.67 69.23
Year-End 2013 Indian Equity Mid/Small-Cap S&P BSE MidCap 21.74 35.37 42.11
Mid-Year 2014 Indian Equity Large-Cap S&P BSE 100 34.18 60.36 54.36
Mid-Year 2014 Indian Equity Mid/Small-Cap S&P BSE MidCap 44.93 32.00 38.67
Year-End 2014 Indian Equity Large-Cap S&P BSE 100 23.81 57.94 52.94
Year-End 2014 Indian Equity Mid-/Small-Cap S&P BSE MidCap 10.87 22.22 35.85
Mid-Year 2015 Indian Equity Large-Cap S&P BSE 100 28.30 49.59 60.50
Mid-Year 2015 Indian Equity Mid-/Small-Cap S&P BSE MidCap 9.09 17.39 42.86
Year-End 2015 Indian Equity Large-Cap S&P BSE 100 35.79 46.79 56.52
Year-End 2015 Indian Equity Mid-/Small-Cap S&P BSE MidCap 58.14 17.78 37.93
Mid-Year 2016 Indian Equity Large-Cap S&P BSE 100 53.26 39.42 58.62
Mid-Year 2016 Indian Equity Mid-/Small-Cap S&P BSE MidCap 77.78 24.44 28.85
Year-End 2016 Indian Equity Large-Cap S&P BSE 100 66.29 30.52 54.60 54.95
Year-End 2016 Indian Equity Mid-/Small-Cap S&P BSE MidCap 71.11 48.53 42.03 46.03
Mid-Year 2017 Indian Equity Large-Cap S&P BSE 100 52.87 34.19 50.93 58.47
Mid-Year 2017 Indian Equity Mid-/Small-Cap S&P BSE MidCap 56.52 43.94 37.31 50.00
Year-End 2017 Indian Equity Large-Cap S&P BSE 100 59.30             53.00 43.40 53.54
Year-End 2017 Indian Equity Mid-/Small-Cap S&P BSE MidCap 72.09 80.00 43.94 44.29

Source: S&P Dow Jones Indices LLC. Data from the SPIVA India Reports 2013 to 2017. Past performance is no guarantee of future results. Table is provided for illustrative purposes.

Diversification

Index investing offers a select basket of stocks designed by independent providers that are neutral and objective when designing the index. Index providers create indices based on fixed methodologies that cater to the index objective. The skewness of individual stock returns can result in increasing the likelihood of underperformance of an active strategy. In his work on the “efficient market hypothesis,” Eugene Fama “concluded that stock prices follow a random walk, causing analysts to be unable to outperform consistently via fundamental or technical analysis.”2

The comparison in Exhibit 4 demonstrates that not only do individual stock strategies tend to be volatile, but over the long term, a consistent approach (such as the S&P BSE SENSEX) can provide consistent returns that, in some cases can be better than individual stock performance.

Exhibit 4. Diversification via Index Versus Individual Stock Approach

Transparency

Index values and information are available publicly. For example, all of the S&P BSE Indices values and methodologies are available at www.asiaindex.co.in. These help to track the index strategy and also to understand historical trends. The traded values of passive structures (such as ETFs) are available on stock exchange websites.

Flexibility

Passive instruments such as ETFs can be traded on the stock exchange and, hence, offer the flexibility of entering and exiting. Therefore, those market participants who are looking for the above characteristics in their investment strategy can opt to include them in their overall portfolios. The debate of active versus passive is always present, but who says one cannot include both to achieve investment goals?

  1. Mahavir Kaswa, “India ETFs Wrap-up 2017,” Feb. 7, 2018.
  2. Anu R. Ganti and Craig Lazzara, Shooting the Messenger, December 2017.

The posts on this blog are opinions, not advice. Please read our Disclaimers.

Latin American Scorecard: Q1 2018

Contributor Image
Silvia Kitchener

Director, Global Equity Indices, Latin America

S&P Dow Jones Indices

March 30, 2018 marked the end of the first quarter of 2018, and so far, the regional indices for Latin America have shown strong performance. The S&P Latin America BMI, which is designed to measure the performance of 287 companies in Brazil, Chile, Colombia, Mexico, and Peru, returned 7.4% for the period. Even more impressive was the S&P Latin America 40, which seeks to represent the 40 largest, most-liquid stocks in the region, as it returned nearly 10% for the quarter—meanwhile, the S&P 500 and S&P Europe 350  were down 0.8% and 2.1%, respectively.

So what were the drivers behind this performance? When we look at each country in the region, we can clearly see that Brazil was the biggest contributor to the overall performance. According to a report published by JP Morgan,[1] Brazil’s significant decline in interest rates could potentially boost investment and consumption. Additionally, among the emerging market countries, Brazil is considered to have the largest earnings power. The report goes on to say, “Operational leverage is ongoing and the full benefit of lower rates (6.75% to 6.5%) is only now going to start to materialize. The BRL currency is seen as well anchored, especially considering the strong external position and high commodity prices.” The report mentions, “Money is flowing into EM and Brazil is a major beneficiary of that.” On the issue of the upcoming elections, “The investor consensus on the October [presidential] elections today is that whoever wins will need to implement reforms.” The country’s broad benchmark, the S&P Brazil BMI, had a strong quarter with an 11.5% return in USD. Companies like Petrobras and Banco do Brasil, among other Brazilian giants, had impressive returns for the first quarter. In fact, 8 of the top 10 performers within the S&P Latin America 40 were from Brazil. Mexico, the second-largest market in the region, did not fare as well. Plagued by the uncertainty around NAFTA and the upcoming presidential elections, the country’s flagship index, the S&P/BMV IPC, gave back nearly 7% for the quarter.

Among the other strong performers in the region were Argentina and Peru. Despite recent concerns around inflation increases in Argentina, there are great expectations for the country if it is promoted to emerging market status, which could result in greater investment in the country. At the end of the quarter, the S&P Argentina BMI returned 6.4% in ARS, with returns within the 50%-56% range for the three- and five-year periods. Despite the recent resignation of the nation’s president, Peru, the smallest market in the region, was still bullish in the first quarter, as the S&P/BVL Peru Select Index returned 4.7% in PEN; the index is designed to represent 18 of the most investable Peruvian stocks.

Chile and Colombia underperformed slightly in terms of their local currencies, but they outperformed in USD. Chile returned -0.8% in CLP and Colombia returned -3.7% in COP for the first quarter. All eyes are now turning to Colombia, which is expected to elect a new president during the upcoming elections on May 27, 2018. It will be interesting to see how the results affect the market.

In terms of sectors, energy and financials companies yielded the highest returns, as expected. The S&P Latin America Energy and the S&P Latin America Financials returned 21% and 17%, respectively.

To see more details about performance in Latin America, please see: S&P Latin America Equity Indices Quantitative Analysis Q1 2018.

[1]   JP Morgan (JPM) Emy Shayo Cherman LatAm Equity Strategy: US Roadshow Feedback: Incredible Optimism with Brazil, March 14, 2018.

The posts on this blog are opinions, not advice. Please read our Disclaimers.

Exploring the G in ESG: The Relationship Between Good Corporate Governance and Stock Performance – Part 2

Contributor Image
Kelly Tang

Former Director

Global Research & Design

Year-to-date, Facebook (FB) was down 7.13% as of April 12, 2018, compared to its 53% total return in 2017. What started as a data breach issue has expanded to encompass management structure, procedures, and safeguard concerns—issues that are all related to corporate governance. Market participants have a tendency to only care about corporate governance when things go wrong, despite empirical evidence that companies with strong governance tend to perform better than those with weak governance.

We have been exploring the “G” component of ESG, and many tech companies in general do not score favorably on the governance front. In a previous blog, we provided a breakdown of the various elements or dimensions that are part of the S&P Dow Jones Indices’ governance score. In this follow-up blog, we explore the return information contained in the governance component and how investors can manage risk by avoiding companies with low governance scores.

To test whether ESG scores, G in particular, correspond to future stock performance, we formed hypothetical, annually rebalanced quintile portfolios, and we ranked them in descending order by scores and tracked their forward 12-month performance. The underlying universe was the RobecoSAM coverage universe, which comprises 400 global companies starting from December 2000 and increasing to over 4,000 stocks in 2017. The quintile portfolios were formed on an annual basis as of December 31 of every year, and returns are in USD.

In regard to the governance score, looking at the period from inception in 2001 to present, there was little distinction in performance between companies in the top three quintiles. However, there was a clear distinction between these quintiles and the bottom quintile (see Exhibit 1). Securities with the lowest governance scores, on average, underperformed (7.84%) those that ranked higher.

The spread between the top and bottom quintile was greatest for the governance criteria, representing almost double the spread for the total ESG score (0.90%).

The asymmetrical return profile suggests that companies that rank well below average on good governance characteristics are particularly prone to mismanagement and risk the ability to capitalize on business opportunities over time. Management strategy and ability, whether superior or compromised, will manifest over time and therefore, economic dimension-scored portfolios should be viewed over longer time horizons as the time element is necessary in revealing whether the strategy is working or not.

As discussed in Part 1, the EDS is comprised of more than just traditional governance criterion and includes business strategy, risk management, and tax strategy—elements that are long term and strategic in nature. The inception data in Exhibit 2 provides a 17-year timeframe in which to gauge the performance of quintile portfolios. The bottom quintile returned 7.84% annualized compared to 9.51% for the first quintile, 10.02% for the second quintile, and 9.58% for the third quintile.

The underperformance of securities with the lowest governance scores is even more readily apparent when viewed over rolling periods. To demonstrate, we calculated annualized rolling one-year, three-year, and five-year returns, and we reported the averages. On average, across all three calculation periods, the Q5 portfolio, which comprises companies with the lowest governance scores, underperformed the Q1 portfolio by 1.8%-2.0% (see Exhibit 3). The results indicate that market participants may be economically better off avoiding securities that rank in the bottom quintile of the governance universe.

In the next blog, we will continue the discussion on ESG scores and stock performance, however with a focus on the “E” and “S” scores.

Sources:

Gompers, Ishii, and Metrick (2003) and Bebchuk, Cohen, and Ferrell (2009)

The posts on this blog are opinions, not advice. Please read our Disclaimers.

Water Risk: Looking Back and Looking Ahead

Contributor Image
David McNeil

Senior Analyst, Corporate Services

Trucost, part of S&P Global

Water scarcity risk has been in the spotlight recently with Cape Town’s efforts to avert “Day Zero” and the risk of taps running dry. Although this risk appears to be receding through radical conservation measures, including wholesale elimination of abstraction rights in some cases, it underlines the common global challenge of increasing fresh water scarcity.

From a business perspective, examples such as Cape Town illustrate that water is shifting from an operational concern of securing day-to-day supplies for production sites, to a wider strategic concern for companies. For example, the 2017 CDP Water Survey found that 70% of respondent companies were now disclosing water targets to their board, and they committed to a new investment of USD 23 billion in water projects in 2017.

Nonetheless, Trucost data indicates that most companies have substantial exposure to water risk in their supply chains that is unmeasured and unreported. For a typical company, as much as two-thirds of water-related impacts occur within the supply chain. In some cases, this can be even more pronounced—Nissan Motor’s supplier engagement in 2017 uncovered supply chain water consumption 20 times that of its direct operations.[1]

Where these water risks aren’t adequately measured, they represent substantial “unpriced risk” to companies, with global-listed companies having undisclosed water risks totalling USD 555 billion.[2] When the full costs of water scarcity and pollution are accounted for, this represents a substantial share of average profit at risk across a number of sectors (see Exhibit 1).

While companies have relied upon historical data when assessing the exposure of their supply chain to water risk, this may be a poor indicator of future risk associated with climate change and rising water scarcity. Recommendations by the G20 Taskforce on Climate Related Financial Disclosure[3] emphasize the need for companies to gather forward-looking data and explore the extent to which their business model and profitability is at risk under different climate change and water scarcity scenarios. Water is a crucial element of climate risk, with current projections pointing to a 40% gap in available supply of fresh water to demand by 2030.[4]

As a response to these risks, companies should understand how their business strategy and growth depend on water. Trucost has worked with business leaders like Ecolab to create industry-leading approaches to value water risks, set context-based water targets, and measure their maturity on important factors like governance, water measurement, target setting, and water stewardship. We’ve recently supported Braskem in setting long-term, basin-level water reduction targets that account for changes in local demand in line with rising scarcity, building on 2040 projections by the World Resources Institute.[5]

To manage water risk effectively, businesses need to consider water risks from every angle—looking back into their supply chain to identify hotspots of water risk and looking ahead to ensure their overall business model is resilient in the face of rising water scarcity.

[1]   CDP (2017), A Turning Tide: Tracking corporate action on water security – CDP Global Water Report 2017.

[2]   Trucost (2018)

[3] FSB (2017) Task Force on Climate Related Financial Disclosures: Final TCFD Recommendations Report.

[4] McKinsey & Company (2009) Charting our Water Future: Economic frameworks to inform decision-making.

[5] World Resources Institute (2016) Aqueduct – Water Risk Atlas.

The posts on this blog are opinions, not advice. Please read our Disclaimers.