The Fed raised rates for the third time this year, bringing the benchmark Fed Fund Target Rate to 1.25%-1.50%, as expected. U.S. Treasuries outperformed Japanese sovereign bonds in 2017, while U.S. Treasuries’ volatility also came down to one-half of the previous level. As of Dec. 13, 2017, the S&P U.S. Treasury Bond Current 10-Year Index rose 2.70% YTD, outperforming the S&P Current 10-Year Japan Sovereign Bond Index by 233 bps.
The outperformance of U.S. Treasuries this year reversed the previous trend, wherein Japanese sovereign bonds delivered higher risk-adjusted return in three- and five-year timeframes due to the better returns and lower volatility (see Exhibit 1).
While the yield of the S&P Current 10-Year Japan Sovereign Bond Index continued to hover around zero, the yields of U.S. Treasuries were trending higher this quarter on the back of the rising-interest-rate environment. The historical yield spread of the two indices widened from 1.72% to 2.32% over the past three years (see Exhibit 2).
The yield pick-up offered Japanese investors an incentive to buy U.S. Treasury bonds, which is in addition to the portfolio diversification benefit. Subject to their investment view on the currency, market participants could decide to hedge the currency exposure or not. Either way, they may be exposed to extra returns or a reduction in returns that can result from hedging or the performance of the foreign currency.
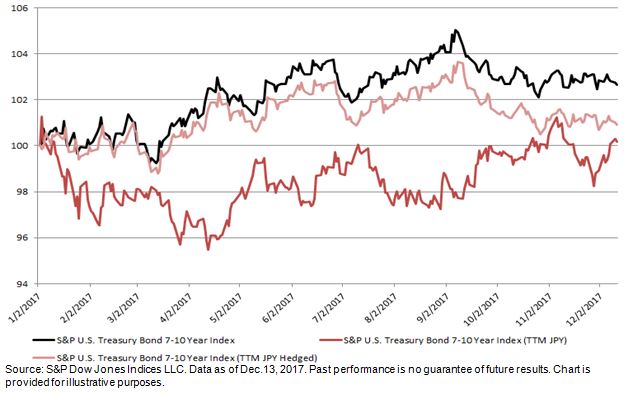
As an example, the S&P U.S. Treasury Bond 7-10 Year Index is designed to measure the performance of the intermediate-term U.S. Treasury bonds. The S&P U.S. Treasury Bond 7-10 Year Index (TTM JPY) and the S&P U.S. Treasury Bond 7-10 Year Index (TTM JPY Hedged) both track the same bonds with returns represented in Japanese yen, while the latter is hedged in an effort to eliminate currency exposure through a one-month forward currency contract. As demonstrated in Exhibit 3, the hedged index closely tracked the underlying index, while the unhedged version was subject to currency exposure volatility.
Hence, aside from the portfolio diversification benefit and currency exposure, allocating to U.S. Treasuries this year offered better yields and total returns than Japanese sovereign bonds.
Exhibit 1: Risk/Return Comparison of the S&P Current 10-Year Japan Sovereign Bond Index and the S&P U.S. Treasury Bond Current 10-Year Index
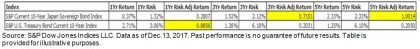
Exhibit 2: Yield-to-Maturity Comparison of the S&P Current 10-Year Japan Sovereign Bond Index and the S&P U.S. Treasury Bond Current 10-Year Index
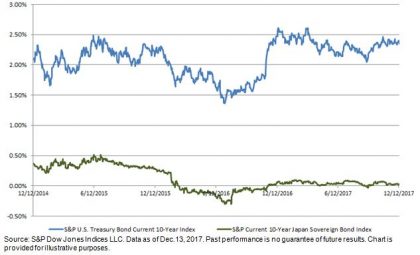
Exhibit 3: Comparison of S&P U.S. Treasury Bond 7-10 Year Indices’ Returns