The active versus passive debate has been a continuous subject of discussion in the evolving asset management industry. S&P Dow Jones Indices launched the first SPIVA India scorecard in 2013 to provide a barometer on this subject. The Indian market has witnessed significant growth (albeit from a small base) in passive investment products that offer lower cost and more transparent access to targeted segments of the market compared with the actively managed products. Passive investment products have been evolving, and there have been an increasing number of products that implement various investment strategies that were once considered exclusive tools used mostly by active fund managers.
Exhibit 1 reviews the percentage of funds that underperformed their respective benchmarks in each category for the five-year rolling period between December 2013 and June 2017. The majority of Indian Equity Large-Cap, Indian Government Bond, and Indian Composite Bond funds underperformed their respective benchmarks for most of the period. Indian ELSS funds had the highest percentage of actively managed funds leading the benchmark over the period.
Exhibit 1: Percentage of Active Funds That Underperformed Their Respective Benchmarks (over a rolling 5-year horizon)
 Source: S&P Dow Jones Indices LLC. Figures based on Mid-Year and Year-End SPIVA India scorecards since December 2013 to June 2017. Chart is provided for illustrative purposes. Past performance is no guarantee of future results.
Indian Equity Large-Cap funds generated relatively slight excess returns over the S&P BSE 100 for the five-year rolling horizon (see Exhibit 2). Moreover, more than 50% of funds failed to beat their benchmarks. Both categories of bond funds—Indian Government Bond and Indian Composite Bond—generated negative excess returns for the five-year rolling horizon, with more than 75% underperforming their respective benchmarks as of June 2017.
Among all the fund categories, the Indian ELSS and Indian Equity Mid-/Small-Cap funds offered the most pronounced excess return over their benchmarks, the S&P BSE 200 and S&P BSE MidCap, respectively. On average, Indian ELSS and Indian Equity Mid-/Small-Cap funds offered an annualized excess return of 225 bps and 402 bps, respectively, over the five-year rolling horizon (see Exhibit 2). After a relook at Exhibit 1, we notice that in the case of the Indian Equity Mid-/Small-Cap category, a fairly large percentage (approximately 40%) of the funds underperformed their benchmark. Hence, in this category, picking the right active fund becomes critical.
Exhibit 2: Rolling Annualized Excess Returns of Equal-Weighted Funds over Their Respective Benchmarks (over a rolling 5-year horizon)
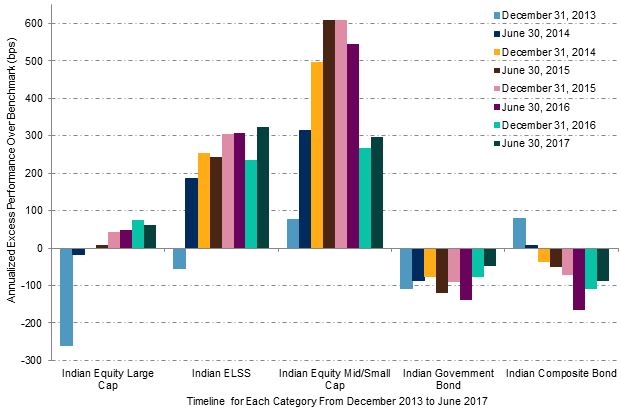 Source: S&P Dow Jones Indices LLC. Figures based on Mid-Year and Year-End SPIVA India scorecards from December 2013 to June 2017. Chart is provided for illustrative purposes. Past performance is no guarantee of future results.