Get Indexology® Blog updates via email.

In This List

OPEC's Cuts Are Shrinking Trading Opportunities

Dividend Growers vs High Dividend Yielders: How They Compared as Interest Rates Rose

Rieger Report: The World is Flat

History of the 401(k)

Green Bond Update for May 2017

OPEC's Cuts Are Shrinking Trading Opportunities

Contributor Image
Jodie Gunzberg

Former Managing Director, Head of U.S. Equities

S&P Dow Jones Indices

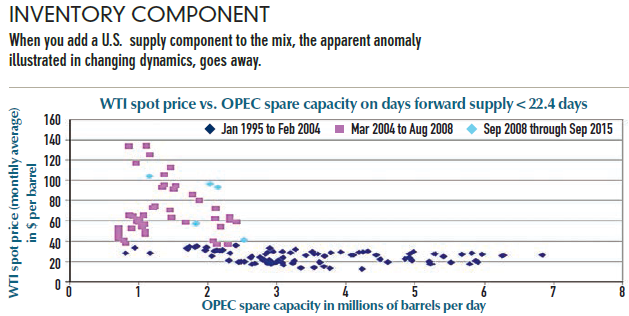
The unintended consequences of OPEC’s policy (in summer of 2014) of flooding the market with oil to lower prices and gain market share are starting to show.  It seems they failed to realize increasing the price by cutting back supply wouldn’t work with high U.S. inventories.  The spare capacity of OPEC does not matter for oil price when U.S. inventories are high.

Source: Till, Hilary. Does OPEC Spare Capacity Matter? Modern Trader Magazine. May 16, 2016. Data Sources are Bloomberg and IEA.

Chinese demand in addition to U.S. production (including Trump’s export policy,) is probably more critical to oil price formation so is likely keeping oil range-bound, even if the possible range is wide.  According to index history, oil could reach between $25 – $85 dollars before setting record moves.   As OPEC cuts and if U.S. inventories decline to low levels, oil prices may increase, so China may use their own reserves or shop around rather than purchase oil at a higher price, capping the high end of the price range.  Worst case scenario, China might start exporting their reserves into the open market, as they have with other commodities, pushing prices back down. If the U.S. continues with high production and inventories, China may buy more oil as the prices drop, putting a floor on the price.

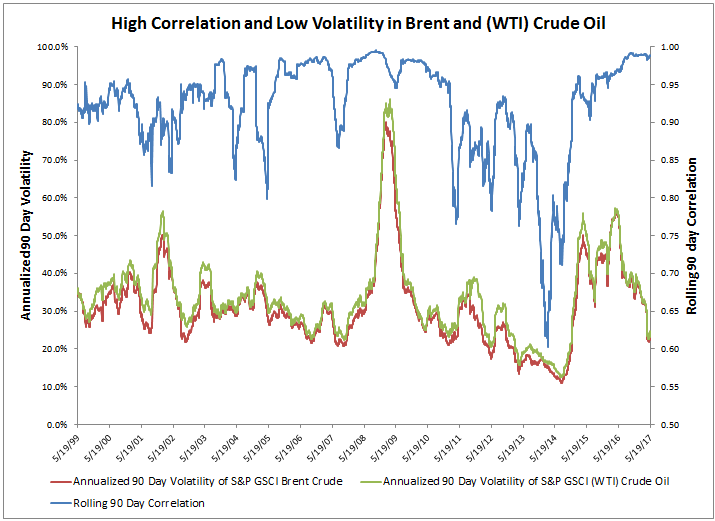
One may think in this case a directional view is highly uncertain so going long or short oil is a risky bet.  That might be true, but unfortunately, the typical spread and volatility trades available when oil  is range-bound may be scarce now.  The correlation between Brent and (WTI) Crude is now nearly perfect, well above its average, and volatility is only about 2/3 of its historical average with Brent at 22.4% and WTI at 23.2% versus averages of 31.3% and 33.9%, respectively.

Source: S&P Dow Jones Indices

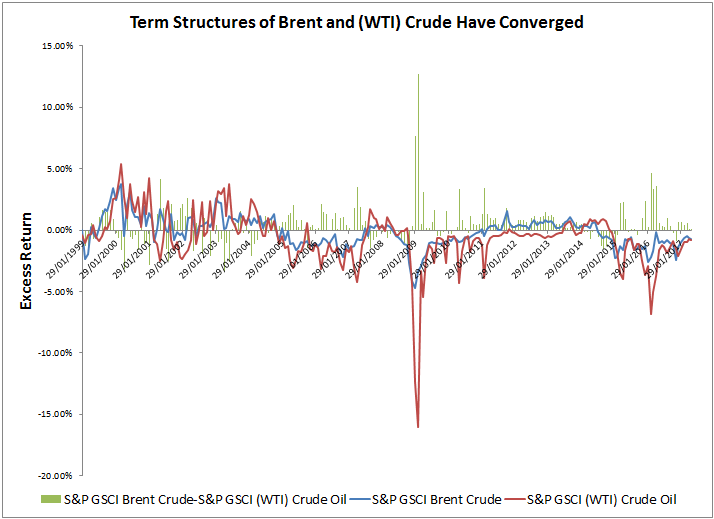
The term structures are also tight.  Historically on average, Crude’s contango is 3.5 times bigger than Brent’s, but now, their term structures are similar with a difference of just 11 basis points, only 1/4 of the average historical absolute difference.

Source: S&P Dow Jones Indices

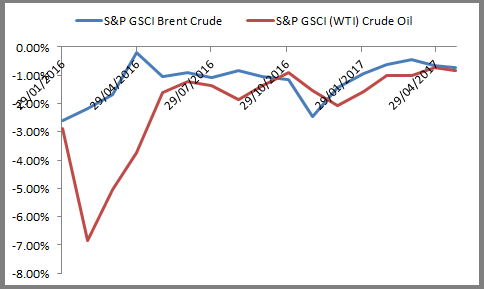
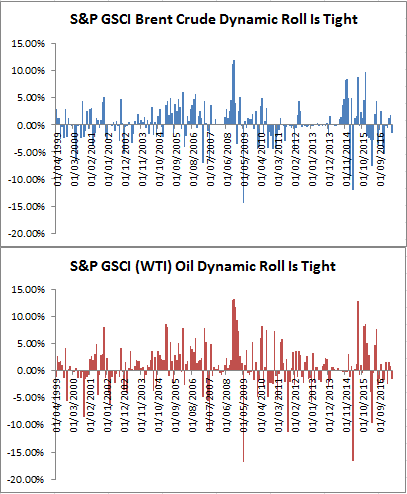
Here’s a closeup of the past year in the graph above:

Source: S&P Dow Jones Indices

The result is the curve positions are difficult to monetize.  Historically, the dynamic rolling strategy that picks the optimal contract on the curve (as measured by highest implied roll yield) every month adds about 40 basis points monthly to Brent and almost double that to (WTI) Crude.  Now, the dynamic roll is underperforming and the difference in spread between the Brent and (WTI) Crude optimal contracts are only 10 basis points, as compared to an average near 40 basis points.

Source: S&P Dow Jones Indices

In this period of market rebalancing, it seems opportunities are hard to find but the good news possibly is there seems to be more stability from the lower volatility, higher correlation and tight term structures.  If it is underpinned by the fundamentals of a recovering oil market, there could be more upside than downside.  This combination of possible upside with low volatility may be attractive for the 2x leveraged versions of oil.


The posts on this blog are opinions, not advice. Please read our Disclaimers.

Dividend Growers vs High Dividend Yielders: How They Compared as Interest Rates Rose

Contributor Image
Kieran Kirwan

Director, Investment Strategy

ProShares

There are generally two types of dividend strategies:

  1. Dividend growers: Those targeting stocks that consistently grow their dividends over time
  2. High dividend yielders: Those focusing on stocks that pay a high dividend yield

Not all dividend strategies are created equal
These dividend strategies are constructed differently and may be used to accomplish different objectives. For example, investors seeking a greater-than-average income may choose high dividend yield strategies. But these strategies tend to have significant weightings in sectors that are highly sensitive to interest rate movements, thus introducing interest rate risk into the equity allocation.

On the other hand, strategies focused on stocks that have grown their dividends consistently (but don’t always have the highest yields) may provide an all-weather dividend solution—one that has the potential to perform well regardless of the direction of rates.

Comparing dividend growers and high dividend yielders in different rate environments
Let’s examine two popular dividend indexes as an example: S&P 500® Dividend Aristocrats® Index (dividend growers) vs. Dow Jones U.S. Select DividendTM Index (high dividend yielders).

For illustrative purposes only. Source: Bloomberg, 5/2/05–3/31/17. Results show average performance of dividend strategies based on monthly interest rate changes. S&P 500 Dividend Aristocrats measures the performance of S&P 500 companies that have increased dividends every year for the last 25 consecutive years. Dow Jones U.S. Select Dividend Index represents the United States’ leading stocks by dividend yield; this index is shown here because it is tracked by the largest high dividend yield ETF by assets. Past performance is not a guarantee of future results. There is no guarantee dividends will be paid. Companies may reduce or eliminate dividends at any time, and those that do will be dropped from the indexes at reconstitution.

The takeaway
As investors consider dividend strategies, it’s important to note the difference between high dividend yield strategies and dividend growth strategies. While the former may provide the higher income many investors crave, they tend to be sensitive to interest rate movements. The latter, on the other hand, offer all-weather potential, having performed well in a variety of interest rate environments.

The posts on this blog are opinions, not advice. Please read our Disclaimers.

Rieger Report: The World is Flat

Contributor Image
J.R. Rieger

Former Head of Fixed Income Indices

S&P Dow Jones Indices

There have been a myriad of articles with headlines and content about rising rates, the coming evisceration and other zombie apocalypse events in the bond markets.   There can be no doubt that yields for fixed income asset classes are low and there is also no doubt that rates will eventually be higher.  How, when and what that will look like is a total unknown.  Meanwhile, the bond yield world is flat.  Bond yields have been flat in 2017 and have lots of reasons why they could remain in a range for the near term. A Rieger Report on December 30, 2016 outlined a number of those factors, many of which still exist today.

Graph 1) Yields of select asset class indices for the period of January 2 through May 23, 2017:

Source:: S&P Dow Jones Indices, LLC. Data as of May 23, 2017. Chart is provided for illustrative purposes. It is not possible to invest directly in an index. Past performance is no guarantee of future results.

What could hold yields down for longer?

  • Uncertainty and the risk-off trade: including Trump, Russia, Syria, China, Brazil, energy, Terrorism/ISIS, Brexit, EU, Inflation/lack of inflation to name a few
  • Low/zero/negative yield environment in Europe and Japan (search for yield)
  • Strong U.S. Dollar
  • New issue supply of investment grade municipal bonds  off the pace set in 2016
  • New issue supply of investment grade U.S. corporate bonds is also off pace for the last three month period vs same period as last year

The value proposition for bonds also remains: predictable income, lower volatility than equities and commodities and continue to be diversifying asset classes.

Eventually rates will rise, the shape of the curve will change and prices will fall and yields will become attractive.  Until then the yield world is flat.

The posts on this blog are opinions, not advice. Please read our Disclaimers.

History of the 401(k)

Contributor Image
Tim Kohn

Head of DC Services and Vice President

Dimensional Fund Advisors

Thirty-nine years ago, the Revenue Act of 1978 was signed, adding section 401(k) to the Internal Revenue Code and creating the first US defined contribution plans. While the code itself simply described a provision under which employees would not be taxed on the portion of income they chose to receive as deferred compensation, it ushered in a new era in retirement saving by paving the way for the modern 401(k) plan.

Although initially assailed as a savings plan for the rich, Richard Stanger—the principal author of the legislation—commented, “We were confident that assets would flow into the system in a reasonable way, not just from the highly compensated, but from the entire workforce.”[1] By 1990 the number of plans offering a 401(k) feature grew to over 97 thousand with 20 million active participants and $385 billion in assets.[2] However, as the equity bull market in the 1990s swelled, so did fund options. It was not uncommon for a plan lineup to consist of 30-50 funds, many of which were redundant. This excess eventually gave way to regulatory oversight, increased fund lineup scrutiny, and the implementation of choice architecture in plan design.

Yet, despite the added surveillance, plan lineup growth continued. In an effort to mitigate the challenges of self-directed investing, managers created target-date funds (TDFs). The prevalence of TDFs would increase dramatically with the passage of the Pension Protection Act of 2006. Now, equipped with an approved set of default investment options, plan sponsors could implement auto-enrollment and auto-escalation of savings rates in an effort to help improve participants’ retirement outcomes.[3] These advances transformed the 401(k) market into the one we recognize today.

Far from perfect and far from failure, America’s ERISA[4] voluntary employer-sponsored retirement system passed its 40th anniversary in 2014 with an estimated 55 million active participants and $4.6 trillion dollars saved.[5] According to Stanger, “The Defined Contribution system is a really good example of something done well; the government enabled it and let the private market innovate. This same framework will address future shortcomings and ensure continued success.”[6] As we look to the future I hope that same creativity, innovation, and focus on outcomes will proliferate the next generation of retirement investment strategies. Since the goal of a retirement account, for many plan participants, is to provide a steady stream of income that will sustain their standard of living in retirement, next generation retirement investment strategies should likewise be aligned with this goal. That alignment entails managing risks that are relevant to retirement income by allocating assets over time in a way that balances the tradeoff between asset growth and income risk management, and providing meaningful communication to participants that enables them to monitor performance in income units rather than just an account balance. This framework is well reflected in the S&P Shift to Retirement Income and Decumulation (STRIDE) Index Series which I believe can serve as the appropriate benchmark for next generation retirement strategies.

The S&P STRIDE INDEX is a product of S&P Dow Jones Indices LLC or its affiliates (“SPDJI”), and has been licensed for use by Dimensional Fund Advisors LP (“Dimensional”). Standard & Poor’s® and S&P® are registered trademarks of Standard & Poor’s Financial Services LLC (“S&P”); Dow Jones® is a registered trademark of Dow Jones Trademark Holdings LLC (“Dow Jones”); these trademarks have been licensed for use by SPDJI and sublicensed for certain purposes by Dimensional. Dimensional’s Products, as defined by Dimensional from time to time, are not sponsored, endorsed, sold, or promoted by SPDJI, S&P, Dow Jones, or their respective affiliates, and none of such parties make any representation regarding the advisability of investing in such products nor do they have any liability for any errors, omissions, or interruptions of the S&P STRIDE Index.

Dimensional Fund Advisors LP receives compensation from S&P Dow Jones Indices in connection with licensing rights to S&P STRIDE Indices.

Dimensional Fund Advisors LP is an investment advisor registered with the Securities and Exchange Commission.

[1] Jim Miller, “In 401(k) We Trust”, DC Dimensions, page 2 (Summer 2014)

[2] “History of 401(k) Plans: An Update”, Employee Benefits Research Institute (February 2005)

[3] Shlomo Benartzi and  Richard Thaler, “Behavioral Economics and the Retirement Savings Crisis”, Science, Vol. 339, Issue 6124, pp. 1152-1153 (March 2013)

[4] Employee Retirement Income Security Act of 1974

[5] Jack VanDerhei,  Sarah Holden,  Luis Alonso, and Steven Bass, “401(k) Plan Asset Allocation, Account Balances, and Loan Activity in 2014”, Employee Benefits Research Institute (August 2016)

[6] Jim Miller, “In 401(k) We Trust”, DC Dimensions, page 7 (Summer 2014)

The posts on this blog are opinions, not advice. Please read our Disclaimers.

Green Bond Update for May 2017

Contributor Image
Dennis Badlyans

Former Associate Director, Global Research & Design

S&P Dow Jones Indices

Green bond Issuance picked up in the first two weeks in May compared with the previous two-week period.  Twenty new green labeled bond offerings were announced, including 11 U.S. municipal offerings with maturity structure (215 unique instruments).  Issuance totaled USD 7.56 billion, of which USD 2.4 billion was in U.S. municipal bonds.  Of note, German development bank KFW issued a medium term note (MTN) for EUR 2 billion (USD 2.2 billion) and Brazilian development bank (BNDS) issued a dual registered (144a and Reg-S) bond in the euro-dollar market worth USD 1 billion.

With the exception of January 2017, when France issued its first green treasury bond—which set a new record for size (USD 7.5 billion) in the green bond market—May 2017 is poised to set a new record for issuance.

Total issuance of bonds labeled as green in 2017 is nearing USD 38 billion and is positioned to surpass 2016 issuance, but the pace will need to accelerate for issuance to reach analyst expectations of USD 150 billion.

Related Indices:

S&P Green Bond Index

S&P Green Bond Select Index

Note that not all bonds listed above may be eligible for index inclusion.  Please see the methodology documents for further details.

The posts on this blog are opinions, not advice. Please read our Disclaimers.