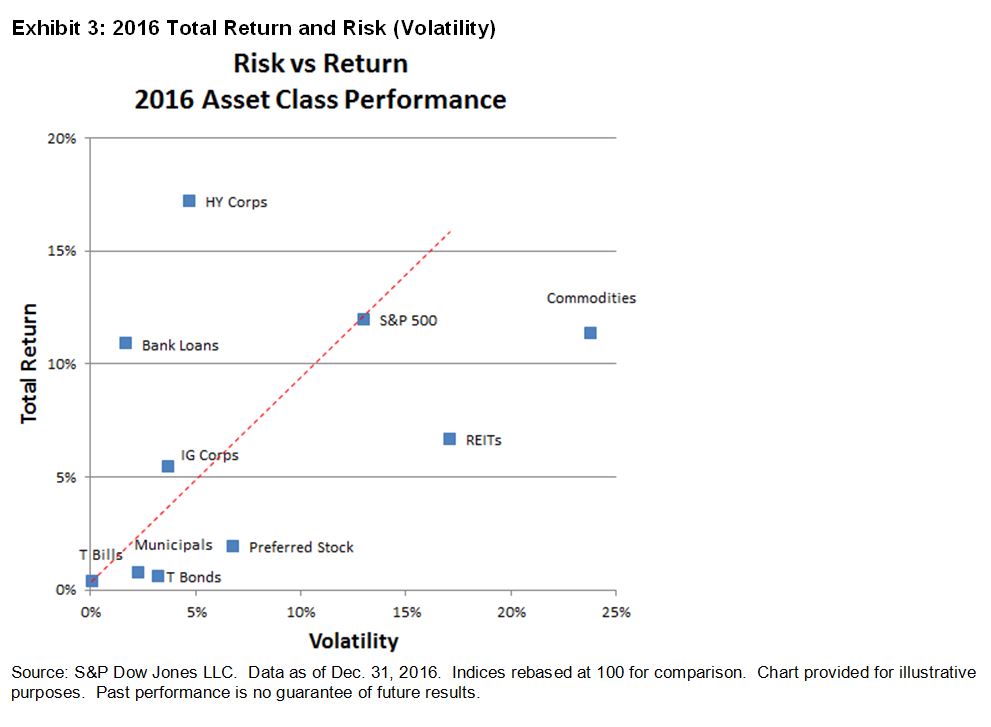
The high-yield corporate bond segment, as measured by the S&P U.S. High Yield Corporate Bond Index, was the top-performing asset class for 2016, posting a total return of 17.2%. Despite a rather tumultuous first quarter, 2016 finished with a clear “risk-on” sentiment as evidenced by the asset classes that topped the list.
On Feb. 11, 2016, it looked like quite the opposite, as high-yield bonds were down over 4%, and U.S. equities (S&P 500®), REITs (Dow Jones U.S. Select REIT Index), and commodities (S&P GSCI) were down 11%, 12%, and 13%, respectively, to start the year. Then, as if lifted by the price of oil bouncing off its bottom, higher-risk asset classes all entered positive teritory by the end of April 2016. The second quarter ended with some increased volatility, as markets reacted to (and then quickly moved on from) the surprise Brexit referendum that was announced on June 24, 2016. A brief flight to quality increased demand for U.S. Treasuries (S&P U.S. Treasury Bond Index), municipals (S&P Municipal Bond Index), and investment-grade corporates (S&P U.S. Investment Grade Corporate Bond Index), and U.S. equities briefly dipped back into the red.
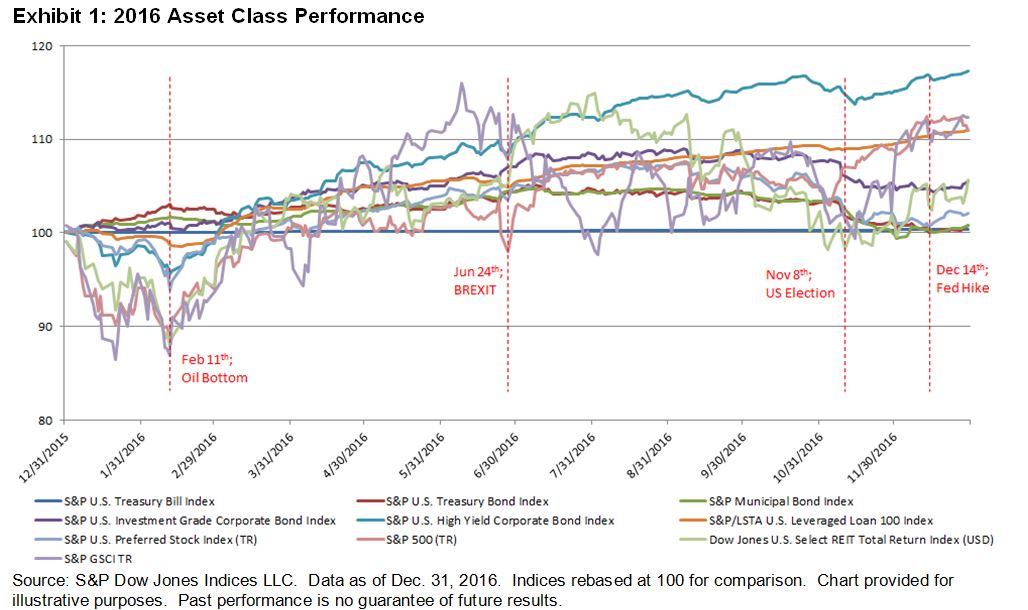
Excluding commodities, the third quarter saw relativley low volatility. Positive economic results and strong earnings from higher beta sectors propelled equities, high-yield corporate bonds, and leveraged loans (S&P/LSTA U.S. Leveraged Loan 100 Index). The fourth quarter largely hinged on market participant sentiment leading up to and then reacting to the unexpected result of the U.S. presidential election. Post-election, a focus on potential inflationary conditions and increased interest rates put upward pressure on bond yields. Market participants ended 2016 favoring higher risk asset classes such as equities (S&P 500), commodities (S&P GSCI), and REITs (Dow Jones U.S. Select REIT Index).
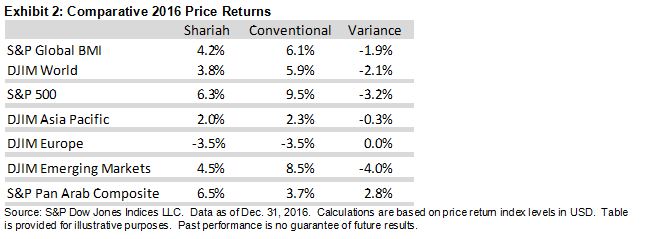
Exhibits 2 and 3 show the total return performance of the major asset classes, taking into account their respective volatility. In Exhibit 2, the column on the left ranks the major asset classes in terms of total return for 2016. The column on the right re-ranks the asset classes by risk-adjusted returns, or Sharpe ratio, based on volatility (i.e., daily standard deviation throughout 2016). The Sharpe ratio is used to compare investment options in a manner that shows total return per unit of risk. Perhaps most surprisingly, leveraged loans (S&P/LSTA U.S. Leveraged Loan 100 Index) jumped to the top with a Sharpe ratio of 6.4, helped by extremely low volatility for the asset class. Investment-grade corporate bonds also benefitted from relatively low volatility moving to the top-three performing asset classes on a risk-adjusted basis. Not surprisingly, commodities (S&P GSCI) experienced the greatest amount of volatility (standard deviation of 23.8%) and fell out of the top-three on a risk-adjusted basis.