Get Indexology® Blog updates via email.

In This List

Industrial Metals On Pace For Worst Month In 4 Years

Rieger Report: Puerto Rico munis see a bounce (last gasp?)

Don’t Blame Tight Supplies for Rising Home Prices

The Fed’s New Normal

Growth, Value and Apple

Industrial Metals On Pace For Worst Month In 4 Years

Contributor Image
Jodie Gunzberg

Former Managing Director, Head of U.S. Equities

S&P Dow Jones Indices

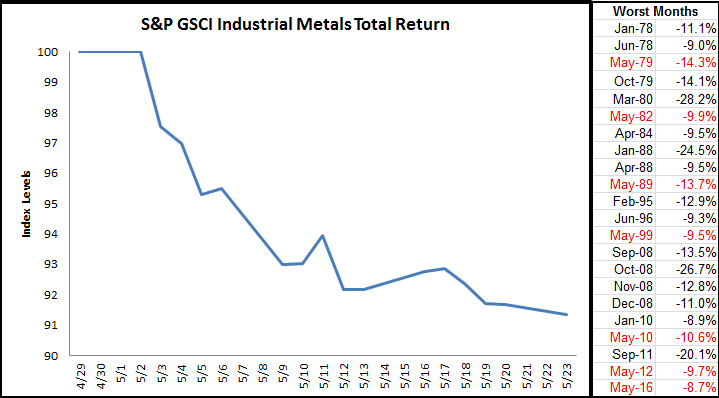
While most of the markets have calmed as investors wait for Brexit and the Fed rate decision, industrial metals are crashing. The S&P GSCI Industrial Metals Total Return is down 8.7% month-to date (through May 23, 2016,) and on pace to record its worst month since May 2012, when it lost 9.7%. At this rate, the sector is having not only its worst month in four years but its 7th worst May since 1978, when the index history started.

Source: S&P Dow Jones Indices.

There has been little correlation of Chinese GDP growth to industrial metals, even copper, but two other factors may be causing the recent drop.  The first is the rising dollar.

Source: http://www.bloomberg.com/quote/DXY:CUR

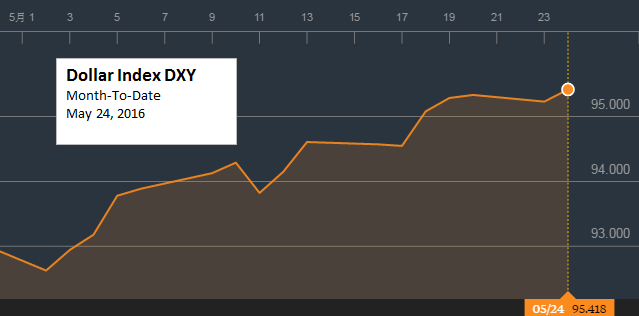
Industrial metals are some of the most sensitive commodities to the US dollar.  In fact, of all 24 commodities, nickel tops the list of the single most susceptible to the rising dollar, dropping 1.9% for every 1% rise in the US dollar. Sure enough nickel is the biggest loser in the index so far in May, down 12%.  The other industrial metals are pretty sensitive too. For every 1% rise in the US dollar over the past ten years, lead, aluminum, copper and zinc lost 1.3%, 1.1%, 1.0% and 0.4%, respectively. Month-to-date in May, lead, aluminum, copper and zinc lost 8.5%, 8.0%, 9.6% and 5.1%, respectively.

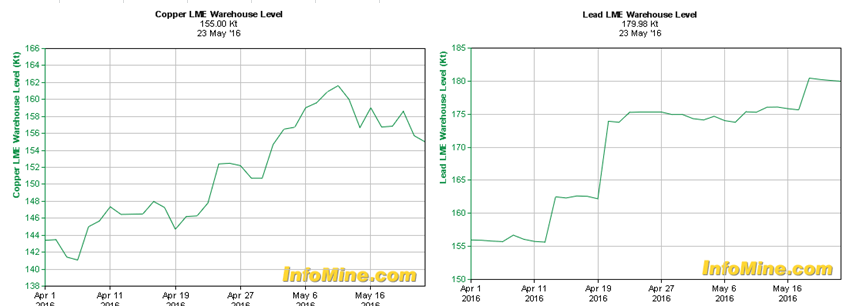
The other reason for the loss in the industrial metal sector is from rising inventories. It is difficult for producers to supply exactly the amount needed.  After some mining closures and supply reductions, prices rose to cause suppliers to bring more of the metals to the market. This month inventories rose significantly for copper and lead that together comprise about half the weight in the sector.

Source: http://www.infomine.com/investment/warehouse-levels/

As for the interest rate decision, all else equal, if rates rise, the dollar may strengthen so will likely hurt the sector but suppliers may adjust again to limit the price drops. On the other hand, if the dollar strengthens, its power to lift the industrial metals is far greater. In the past 10 years, for every 1% move down in the US dollar, gains in lead, nickel, copper, zinc and aluminum have been 7.2%, 6.1%, 5.3%, 4.6% and 2.2%, respectively. That’s a pretty strong upside potential to downside risk from the US dollar.

The posts on this blog are opinions, not advice. Please read our Disclaimers.

Rieger Report: Puerto Rico munis see a bounce (last gasp?)

Contributor Image
J.R. Rieger

Former Head of Fixed Income Indices

S&P Dow Jones Indices

The rocky road that is the Puerto Rico municipal bond market continues.  Last week’s bi-partisan Puerto Rico Restructuring Bill also referred to as the ‘rescue bill’ has created a reason for the bond market to react positively.  There are ramifications to the ‘rescue bill’ however including potentially eroding bondholder (creditor) provisions for repayment.  Meanwhile, bondholders of the Puerto Rico Government Bank debt have rekindled their lawsuit seeking to retain their protections as creditors.  The net result: the S&P Municipal Bond Puerto Rico General Obligation Index is reflecting a 2.29% positive total return so far in May but not without volatility:

  • The weighted average price of bonds in the Index hit a record low of 68.38 on May 10th. (Prices of  bonds represent a percentage of par value)
  • The weighted average yield of bonds  in the Index hit a 2016 high on May 10th of 10.89% and have dropped 36 basis points since then to end at 10.53%.
  • The impact on the broader municipal bond market can be seen in the high yield segments: the S&P Municipal Bond High Yield Index has returned over 4% year-to-date and the S&P Municipal Bond High Yield Index ex-Puerto Rico has returned over 5%.
Source: S&P Dow Jones Indices, LLC. Data as of May 20th 2016. Chart is provided for illustrative purposes. It is not possible to invest directly in an index. Past performance is no guarantee of future results.

The posts on this blog are opinions, not advice. Please read our Disclaimers.

Don’t Blame Tight Supplies for Rising Home Prices

Contributor Image
David Blitzer

Former Managing Director and Chairman of the Index Committee

S&P Dow Jones Indices

The S&P/Case-Shiller National Home Price Index shows prices of existing single family homes rising 5.3% annually in the last few months, well above the rate of inflation. Recent comments cite the low inventory of homes for sale as a leading factor in higher prices. Housing markets are local and some communities may be seeing house prices driven up by a shortage of homes for sale. However, nationally low unemployment; low mortgage rates and an improving economy outweigh inventory issues.

The chart shows the S&P/Case-Shiller National Home Price Index (red, numbers of the right hand scale), sales of existing homes at annual rates (dark blue, in millions of houses per year on the left hand scale) and the inventory-sales ratio or months-supply (green, also on the left).

The current level of months-supply at 4.7 is much lower than the housing boom-bust era of 2006-2012, but it is almost the same as the 1997-2005 period, the last time we might recall a somewhat normal housing market. Looking farther back to the 1990-1996 period the months-supply was much higher. However, then the economy was coming off an earlier housing boom-bust. In 1990-1991 the Fed raised interest rates, housing slowed and inventories surged.  Given history, the months-supply isn’t the prime factor in rising home prices.

Since 2010, home prices and sales have risen together while the months-supply has stayed in a range of 4 to 4.8 months. The availability of homes for sale has kept up with rising prices and expanding sales.  If supply isn’t the cause, then factors outside of the housing market are likely drivers of rising house prices.  Mortgage rates, which have fallen from about 5% to 3.5% for 30-year fixed rate loans since 2010, are contributing to rising home prices.  Improved consumer confidence and the decline in unemployment are also positive factors behind home prices.

If the Fed pushes interest and mortgage rates up over the next year or two, and if the unemployment levels off as it approaches full employment, the rise is home prices is likely to be tempered. The months-supply figures will probably settle between 4 and 5 months.

The next S&P/Case-Shiller Home Price Index report is due on May 31st and will reveal if prices are continuing to climb at better than a 5% pace.

The posts on this blog are opinions, not advice. Please read our Disclaimers.

The Fed’s New Normal

Contributor Image
David Blitzer

Former Managing Director and Chairman of the Index Committee

S&P Dow Jones Indices

Since the demise of Bear Stearns and Lehman Brothers in 2008, Federal Reserve policy has focused on containing market turmoil and disruption.  Current Fed policy built on a massively expanded balance sheet (first chart); the quantitative easing that inflated the balance sheet and the Fed funds rate glued to the zero lower bound (second chart). This all resulted from efforts to limit turmoil and curb disruption. Through the last ten years, financial market stability was as equally important as low inflation and unemployment.

This is about to change.  The Minutes of the April 26-27 FOMC meeting include a discussion of the relationship between monetary policy and financial stability:

“Most participants judged that the benefits of using monetary policy to address threats to financial stability would typically be outweighed by the costs associated with deviations from the Committee’s employment and price-stability objectives induced by such actions; some also noted that the benefits are highly uncertain.”

The Fed is not abandoning the markets and ignoring market turmoil. Rather, it is recognizing that policy actions designed to temper any market bump can get in the way of their dual mandate of low inflation and full employment. They note that there may be times when market disruption is so severe that failing to respond would damage the Fed’s policy goals:

“Nonetheless, participants generally agreed that the Committee should not completely rule out the possibility of using monetary policy to address financial stability risks, particularly in circumstances in which such risks significantly threatened the achievement of its dual mandate and when macroprudential tools had been or were likely to be ineffective at mitigating those risks.”

For ten  or more years commentators have cited the “Fed Put,” the idea that if markets dived the Fed would step in with low interest rates and liquidity to prop things back up.  Many investors believed that the Fed was providing downside protection to help people exit positions in a collapsing market.

Looking back the Fed Put was more myth than reality.  The comments in the April 26-27 Minutes suggest that the Put is no more.

Charts from St. Louis Federal Reserve Bank FRED economic data

The posts on this blog are opinions, not advice. Please read our Disclaimers.

Growth, Value and Apple

Contributor Image
David Blitzer

Former Managing Director and Chairman of the Index Committee

S&P Dow Jones Indices

The news that Berkshire Hathaway purchased a billion dollars of Apple stock sparked questions – Will S&P DJI re-classify Apple as a value stock? How are stocks divided between growth and value? Among growth and value, which is ahead year-to-date?

Currently S&P DJI classifies Apple as a growth stock. Growth-value classifications are reviewed annually in December based on a quantitative analysis of financial factors. Whether Apple’s classification is changed depends on the how the numbers add up when the next review is done.

Each stock is assigned a value score and a growth score. The value score is based on the book-to-price, earnings-to-price and sales-to-price ratios. The growth score is based on momentum over 12 months; the changes in earnings per share and the growth of sales per share, each over the last three years.  Scores are normalized to make the numbers comparable. Then the stocks in the S&P 500 are ranked by the ratio of their growth score to their value score. The first third of the rankings – highest ratio of growth to value – are growth stocks, the last third – lowest ratio of growth to value – are value stocks and the middle third are apportioned between growth and value based on their scores.

The result is the S&P 500 Growth index and the S&P 500 Value index. These can be used to tell which style lead, or lagged, during past market moves.  The chart compares the performance of the growth and value indices since early 2007 when Apple announced the first iPhone.  The shaded area shows the percentage change in the growth index over the last six months less the percentage change in the value index over the same six month period.  Above the horizontal axis growth is winning, below the axis value is winning.

The indices also let analysts benchmark a stock against other stocks with similar characteristics.  The second chart compares Apple to both the S&P 500 Growth and S&P 500 Value. The data are re-based to a common starting point of 100 in February 2007. The chart uses a logarithmic scale so that both Apple (which rose by 10 times) and the indices (which rose by a lot less) can be shown on the same page.  Apple outpaced both growth and value. Of course, past performance is no guarantee of the future and whether Apple is growth or value at the next review remains to be seen.

A detailed description of the growth and value indices is in S&P U.S. Style Indices Methodology available on www.spdji.com

The posts on this blog are opinions, not advice. Please read our Disclaimers.