Get Indexology® Blog updates via email.

In This List

Safe Spread Alternative: The S&P 500® Corporate Bond Index

Rieger Report: Puerto Rico - Muni Bond Wealth Destroyer

Asian Fixed Income: Chinese Corporates’ Spread Widened With Headline Risk

The Canadian Corporate Comeback

One Commodity Conundrum Despite 2nd Best April Ever

Safe Spread Alternative: The S&P 500® Corporate Bond Index

Contributor Image
Dennis Badlyans

Former Associate Director, Global Research & Design

S&P Dow Jones Indices

  • The May 2016 IIF Portfolio Allocation Trends report confirms the generally defensive tone among market participants, with investors balancing between higher quality and higher yield.
  • The S&P 500 Corporate Bond Index is the corporate bond counterpart to the market bellwether, the S&P 500 equity index.
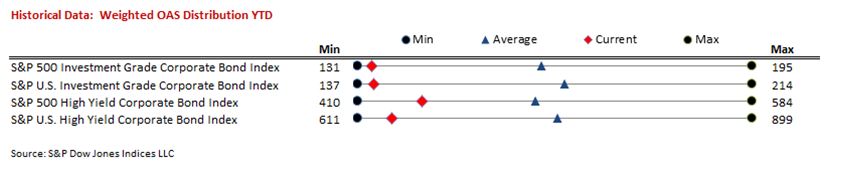
  • With an average option-adjusted spread (OAS) of approximately 425 bps, the S&P 500 High Yield Corporate Bond Index presents a unique credit alternative, bridging the gap between investment grade (approximately 150 bps) and traditional high yield (approximately 650 bps).

Directional Uncertainty Driving Decisions

Portfolio flow data reveals that market participants have generally been favoring fixed income over equity, favoring emerging markets over developed markets, and favoring emerging market high grade over emerging market high yield.  Since the strong rally starting in mid-February 2016, appetite for risky assets appears to have increased, but market participants have been differentiating more on quality.  This demand pattern may be a reflection of a defensive tone of market participants who want exposure to higher yields but lack conviction in directionality of the market in the coming months.

One way for market participants to express this is to incorporate exposure to the S&P 500 High Yield Corporate Bond Index which can enhance yields with quality in mind.

The S&P 500 Corporate Bond Index is designed to measure the performance of the debt issued by the companies that constitute the S&P 500.  The index tracks both investment-grade and high-yield issuers.  Generally speaking, the constituents are of higher quality than those of traditional corporate indices such as the S&P U.S. Investment Grade Corporate Bond Index and the S&P U.S. High Yield Corporate Bond Index.

The S&P 500 High Yield Corporate Bond Index presents a unique credit alternative to bridge the gap between existing investment grade, which offers spread levels of around 150 bps, and high-yield corporate credit, which offers north of 600 bps in spread.  Returns on the S&P 500 High Yield Corporate Bond Index have a high correlation to the S&P U.S. High Yield Corporate Bond Index as well as other peer indices while the constituents of the index have had a lower instance of default historically.

Capture

Recent Performance

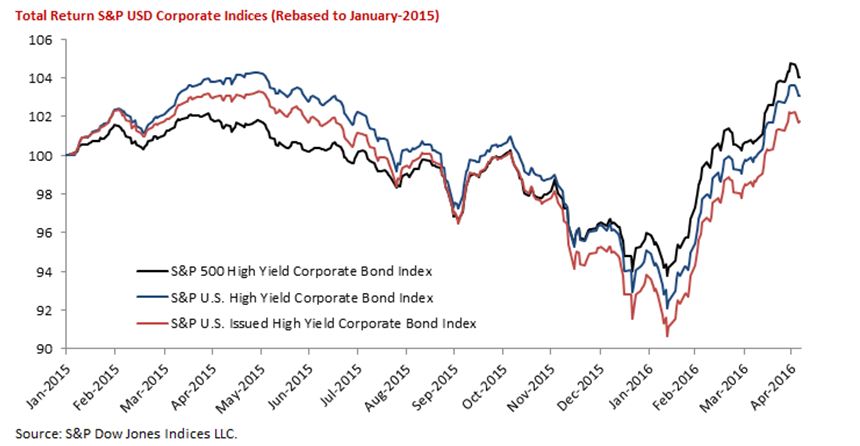
The weighted average of OAS of the S&P 500 High Yield Corporate Bond Index is 438 bps, which sits roughly halfway between traditional investment-grade indices, with OAS of 134 bps, and the traditional, broad high-yield corporate index, with OAS of 636 bps.  Since the peak levels seen on Feb. 11, 2016, U.S. dollar credit spreads have tightened dramatically, with the high yield indices registering returns of over 10% since.

Capture

The posts on this blog are opinions, not advice. Please read our Disclaimers.

Rieger Report: Puerto Rico - Muni Bond Wealth Destroyer

Contributor Image
J.R. Rieger

Former Head of Fixed Income Indices

S&P Dow Jones Indices

There is gap between the par amount and market value of Puerto Rico municipal bonds that has now broached over $40billion.  While some of this can be accounted for as zero coupon debt, the fall in market value of the S&P Municipal Bond Puerto Rico Index is a startling reminder that credit and political risk can sting investors.

Year-to-date, Puerto Rico General Obligation bonds have returned a negative 4.07%.  Meanwhile, high yield municipal bonds excluding Puerto Rico have been resilient.  The S&P Municipal Bond High Yield ex-Puerto Rico Index has seen a total return (YTD) of 4.3%.

Chart 1:  Total Par & Market Values of Bonds in the S&P Municipal Bond Index:

Source: S&P Dow Jones Indices, LLC. Data as of May 4th 2016. Chart is provided for illustrative purposes and reflects hypothetical historical performance. It is not possible to invest directly in an index. Past performance is no guarantee of future results.
Source: S&P Dow Jones Indices, LLC. Data as of May 6th 2016. Chart is provided for illustrative purposes and reflects hypothetical historical performance. It is not possible to invest directly in an index. Past performance is no guarantee of future results.

Table 1: Yields (Yield to Worst) and Year to Date Returns of Select Municipal Bond Indices:

Source: S&P Dow Jones Indices, LLC. Data as of May 4th 2016. Chart is provided for illustrative purposes and reflects hypothetical historical performance. It is not possible to invest directly in an index. Past performance is no guarantee of future results.
Source: S&P Dow Jones Indices, LLC. Data as of May 6th 2016. Chart is provided for illustrative purposes and reflects hypothetical historical performance. It is not possible to invest directly in an index. Past performance is no guarantee of future results.


The posts on this blog are opinions, not advice. Please read our Disclaimers.

Asian Fixed Income: Chinese Corporates’ Spread Widened With Headline Risk

Contributor Image
Michele Leung

Former Director, Fixed Income Indices

S&P Dow Jones Indices

According to the S&P China Corporate Bond Index, the market value of Chinese corporate bonds was approximately CNY 26.4 trillion and represented 36% of the overall China bond market as of May 5, 2016.  It is a robust expansion compared with the mere 6.7% exposure in 2007 (see Exhibit 1).

The yield-to-maturity of the S&P China Corporate Bond Index came down 170 bps to 3.66% in 2015. This spread tightening in 2015 was largely due to improved liquidity, particularly with the correction in A-shares in the first half of 2015.

However, this trend is reversing as fundamentals start to weigh in.  Defaults and concern about the deteriorating credit quality of Chinese corporates captured plenty of global headline news.  Investors raised concern about state-owned-enterprises, particularly those in the industries affected by overcapacity, as government support can no longer be assumed. The yield-to-maturity of the S&P China Corporate Bond Index widened 18bps to 3.84% year-to-date, while its total return climbed 0.49% in the same period.

Across sector-level indices, industrials took the biggest hit with recent defaults in the steel, mining, and cement sectors.  The option-adjusted spread of the S&P China Industrials Bond Index was the highest; it widened 50 bps to 155 bps over the three-month period ending May, 2016 (see Exhibit 2).

Exhibit 1: Market Value of the S&P China Corporate Bond Index and the S&P China Government Bond Index

20160509a

Exhibit 2: Option Adjusted Spread of the S&P China Corporate Bond Index and its Subindices

20160509b

The posts on this blog are opinions, not advice. Please read our Disclaimers.

The Canadian Corporate Comeback

Contributor Image
Kevin Horan

Former Director, Fixed Income Indices

S&P Dow Jones Indices

Yields of Canadian corporate investment-grade and high-yield bonds have been trending lower (up in price) since the beginning of March 2016.  Year-to-date, the S&P Canada Investment Grade Corporate Bond Index returned 1.59% while the S&P Canada High Yield Corporate Bond Index returned 4.54% as of April 30, 2016.

The beginning of April saw yield increase by 9 bps for investment grades and 58 bps for high yield from April 7-19, 2016, as measured by the S&P Canada Investment Grade Corporate Bond Index and the S&P Canada High Yield Corporate Bond Index.  In spite of the one-week increase in yields, the indices rallied after April 19, 2016, going into the end of the month.  Investment-grade bonds moved tighter by only 4 bps, but high yield stepped it up by tightening 32 bps.  In the end, the April index returns were 0.55% for investment grade and 2.16% for high yield.

The performance by industry sectors shows that all sectors had positive returns for the month.  Energy, which is a significant weight in both investment grade (7.7%) and high yield (25.7%), has recently been a notable contributor after past months of negative headlines.  Up until April 25, 2016, investment-grade financials had returned -0.06% for the month, but performance during the last week of the month pushed the large sector (63.8%) up for a return of 0.14% in April.  High-yield consumer discretionary, which accounts for 48.6% of the index, and returned 0.80% for April; this sector contains issuers such as Golf Town Canada, Mattamy Group, Quebecor Media, Brookfield, and AutoCanada, Inc.

Source: S&P Dow Jones Indices LLC. Data as of April 30, 2016. Past performance is no guarantee of future results. Table is provided for illustrative purposes.


Source: S&P Dow Jones Indices LLC. Data as of April 30, 2016. Past performance is no guarantee of future results. Chart is provided for illustrative purposes.


The posts on this blog are opinions, not advice. Please read our Disclaimers.

One Commodity Conundrum Despite 2nd Best April Ever

Contributor Image
Jodie Gunzberg

Former Managing Director, Head of U.S. Equities

S&P Dow Jones Indices

The Dow Jones Commodity Index and S&P GSCI total return indices gained 9.1% and 10.1%, respectively, in April. For the S&P GSCI, it was the best month in a year, and the second best April ever in history since 1970, only after last year’s April, when it gained 11.1%. Further, the S&P GSCI is up 15.5% since Feb 29, 2016, making this the first consecutive positive two months in two years, since Mar-Apr 2014, but marks the biggest consecutive two months in almost seven years since May-Jun 2009 when it gained 20.4%.

Source S&P Dow Jones Indices.

There has never been an April with this many positive commodities, posting 20 of 24 winners (coffee, Kansas wheat, live cattle and feeder cattle lost.) Only six months in history have had more positive commodities and April 2016 had the most winners since Feb. 2014, when 22 commodities were positive.

Source: S&P Dow Jones Indices.
Source: S&P Dow Jones Indices. May 2004, Feb. 2010 and Sep. 2010 also had 20 winners.

It is not surprising to see the S&P GSCI deliver strong returns in April given that historically on average it is the best month. However, it is concerning that only four commodities (copper, gold, cotton and lean hogs – and the lowest count since November’s Nightmare) are in backwardation, a condition that generally reflects a shortage.  There have been 24 months with better returns than in Apr. 2016, but the backwardation count this low concurrently with the high returns hasn’t happened since 1974, when there were only six commodities in the index. What it means is the supply/demand fundamentals may not be in place to support this commodity rally and that it may be driven more by the falling dollar.

Source: Bloomberg
Source: Bloomberg

The posts on this blog are opinions, not advice. Please read our Disclaimers.