Get Indexology® Blog updates via email.

In This List

Seven Commodities To Love

Mexico Fixed Income Markets: Foreign Investors Repositioning in Linkers

February Brings Both the Positive and the Negative in European Government Bond Markets

Will History Repeat Itself in Feb. 2016?

Dividend and Low Volatility-Investments

Seven Commodities To Love

Contributor Image
Jodie Gunzberg

Former Managing Director, Head of U.S. Equities

S&P Dow Jones Indices

It’s no secret commodities have been struggling in 2016 adding pressure to their greatest catastrophe in history. While much of this is from energy, with a year-to-date loss of 24%, the S&P GSCI Non-Energy is only down 1.4% for the year. Further, the precious metals sector in the index is up 17.4% year-to-date. Now that is something to love, and they aren’t the only commodities posting gains this year. Seven commodities are positive year-to-date including gold +17.7%, silver +14.4%, lean hogs +6.6%, zinc +5.9%, lead +2.0%, soybeans +1.1% and corn +0.4%. In honor of Valentine’s Day, below is a poem I wrote to give them the love they deserve.

VDay Comms

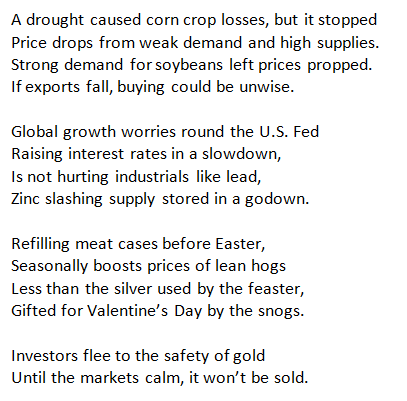
I hope you enjoyed something fun and light with this gift from me to you. Happy Valentine’s Day!

The posts on this blog are opinions, not advice. Please read our Disclaimers.

Mexico Fixed Income Markets: Foreign Investors Repositioning in Linkers

Contributor Image
Dennis Badlyans

Former Associate Director, Global Research & Design

S&P Dow Jones Indices

  • In January, foreign investors rotated positions back into UDIBonos, adding about 1.2% market share—a significant allocation to this investor base.
  • Flows into government bonds as a whole remain muted—in net, foreign investors withdrew about MXN 9 billion over the same period. (CETES: decreased MXN 32 billion; MBonos: increased MXN 7 billion).
  • January inflation surprised analysts at 0.38% vs. expectation of 0.28% according to the Banamex survey released on Feb. 5, 2016. Additionally, the survey shows that analysts expectation for full year 2016 inflation to be at 3.07%.
  • UDIBonos performance has lagged: current breakeven-inflation levels are below analysts’ expectations for inflation.

Throughout most of 2015, inflation in Mexico surprised analysts with its downside, finishing the year at a historical low of 2.13% (year-over-year).  By mid-year 2015, foreign investors began to pare back exposure to inflation-linked UDIBonos, which they had been allocating aggressively to over the 12-month period prior.  While foreigners are not the dominant price setters for UDIBonos, the reduction in position, which amounted to about 3% (May-December 2015) of market share, or MXN 37 billion (using the average UDI/MXN), weighed on performance of the inflation-linked instruments.

Capture

It is worth noting that although net foreign flows into government bonds have been muted, investors rotated out of both nominal and real rates, adding to bills (Chart pack available on request) and keeping exposure to Mexican pesos.

Over the year, average UDIBonos yields, as measured by the , were up 110 bps, eroding coupon and inflation carry on the bonds, leading to a 1.8% loss in terms of total return in pesos.  This is compared to yields on MBonos (nominal bonds), as measured by the S&P/Valmer Mexico Sovereign Bond Index, which moved up only 32 bps, with the index returning 4.3%, buoyed by its coupon carry.


Capture

As of January 26, 2016, foreign investors added MXN 15.7 billion (UDI 2.9 billion) YTD to UDIBonos and MXN 7 billion YTD to MBonos, while they reduced CETES positions by MXN 32 billion.  Although the addition to UDIBonos doesn’t seem outsized in cash terms, we note that foreigners own about 60% of the MBonos market, versus 11% of the UDIBonos market.  This highlights the important increase in relative terms to allocations in the inflation-linked bonds.  Both MBonos and UDIBonos have benefited, as yields have declined by as much as 50 bps on UDIBonos and 30 bps on MBonos.

Capture

The relative performance leaves break-even points only marginally wider and below the 3% handle.  January 2016 inflation in Mexico surprised analysts at 0.38%, versus the expectation of 0.28% (Banamex survey), with base effects driving the year-over-year figure to 2.61% from 2.13% in December 2016.  Although seasonality of inflation (February-March) warrants caution, year-end inflation is expected to rise to 3.1% (Banamex survey), while break-even points calculated using the June-2022 bond from the S&P/Valmer Mexico Sovereign Bond Index versus June-2022 bond from the S&P/Valmer Mexico Government Inflation-Linked UDIBONOS Index are pricing 2.7%, or 37 bps, below current year-end inflation expectations.

Capture

The posts on this blog are opinions, not advice. Please read our Disclaimers.

February Brings Both the Positive and the Negative in European Government Bond Markets

Contributor Image
Heather Mcardle

Director, Fixed Income Indices

S&P Dow Jones Indices

Germany and Luxembourg government bond yields have tightened nearly 30 bps since the beginning of 2016, moving the S&P Germany Sovereign Bond Index and the S&P Luxembourg Sovereign Bond Index yields back into negative territory (see Exhibit 1).  Yields on both indices last hit negative territory in April 2015, at the height of the Greek debt crisis.  Swiss government bonds have been consistently negative since January 2015, and the S&P Switzerland Sovereign Bond Index is has tightened 22 bps since the beginning of 2016.

Capture

Due to the inverse relationship between yields and prices, while yields are negative the performance of these indices is positive.  As of Feb. 8, 2016, performance of the S&P Switzerland Sovereign Bond Index was one of the highest in the eurozone, at 3.4% YTD; the S&P Germany Sovereign Bond Index came in at 3.04% YTD, and the S&P Luxembourg Sovereign Bond Index returned 1.70% YTD (see Exhibit 2).

Capture

Fears over the financial health of some of the larger European banks and the volatility in the stock market are causing risk aversion and are leading some investors into the relative safety of European government bonds.  This, coupled with indications that the ECB might increase its QE program in March, could be setting the stage for continued negative yields with positive performance in this “safe” asset class.

The posts on this blog are opinions, not advice. Please read our Disclaimers.

Will History Repeat Itself in Feb. 2016?

Contributor Image
Kevin Horan

Former Director, Fixed Income Indices

S&P Dow Jones Indices

The year 2016 appears to have gotten off to a similar start to the beginning of 2015.  The S&P 500® Bond Index has returned 0.92% as of Feb. 8, 2016, while in 2015 the index was up 1.57% as of Feb. 8, 2015.  Maybe the month of February will end up being more similar than investors might want.  The yield-to-worst of the S&P 500 Bond Index ended February 2015 13 bps wider than where it began the month.  The same might be true this year, as the yield of the index, at 3.55% as of Feb. 8, 2016, is almost even to January’s 3.56% so the question is whether yields widen out from here as they did last year.

By now, many have heard the news go on about the lower prices of oil and materials.  The S&P 500 Energy Corporate Bond Index has lost 3.71% YTD, followed by a 0.87% YTD drop in the S&P 500 Materials Corporate Bond Index.

Unlike recent index performance, January’s and February’s spread widening has crept into industry sectors other than energy and materials.  Excluding energy and materials, the largest changes in option adjusted spread (OAS) to U.S. Treasuries have been seen in the telecommunication services (up 51 bps) and consumer discretionary (up 41 bps) sectors.

Exhibit 1: OAS History of the S&P 500 Bond Index Industry Sectors
OAS History of the S&P 500 Bond Index Industry Sectors

Source: S&P Dow Jones Indices LLC.  Data as of Feb. 8, 2016.  Past performance is no guarantee of future results.  Chart is provided for illustrative purposes.

Related to the widening of the industry sector spreads is the widening of the credit rating indices.  Of note is that the current OAS level of 235 bps for the S&P 500 BBB Investment Grade Corporate Bond Index has risen close to the starting point of 287 bps seen back in June 2015 for the S&P 500 BB High Yield Corporate Bond Index.

Exhibit 2: OAS History of the S&P 500 Bond Index Rating Categories
Blog_20160209 Exhibit-2

Source: S&P Dow Jones Indices LLC.  Data as of Feb. 8, 2016.  Past performance is no guarantee of future results.  Chart is provided for illustrative purposes.
Total Rate of Return Performance for the S&P 500 Bond Index And Its Sub-Indices

Source: S&P Dow Jones Indices LLC.  Data as of Feb. 8, 2016.  Past performance is no guarantee of future results.  Table is provided for illustrative purposes.

The posts on this blog are opinions, not advice. Please read our Disclaimers.

Dividend and Low Volatility-Investments

Contributor Image
Todd Rosenbluth

Director of ETF and Mutual Fund Research

S&P Capital IQ Equity Research

It’s been a tough start to the new year for the S&P 500®, with a 6.4% decline (as of Feb. 3, 2016).  However, the year-to-date performance of certain factor-focused smart-beta indices tied to subsets of the S&P 500 is relatively bright.

The S&P 500 is a well-diversified US equity index, seeking to provide exposure to companies with various characteristics.  While some of these factors, such as growth or high beta, can be viewed as cyclical and  may tend to lead an index constituent to perform well in a “risk-on” environment, others, such as low volatility or dividends, may be more defensive and potentially lead constituents to perform  better in a “risk-off” market.  Some of these defensively oriented indices have demonstrated higher performance in the start the year.

The S&P 500 Low Volatility Index is designed to track the 100 least-volatile stocks within the broader S&P 500 as measured by S&P DJI’s proprietary methodology.  This low-volatility index is rebalanced and reconstituted on a quarterly basis in an effort to regularly provide exposure to less volatile securities.

As of January 31, 2016, financials (27%), consumer staples (22%), industrials (16%), and utilities (12%) were the largest sector weights in the S&P 500; the MSCI USA Minimum Volatility Index, which is tied to a different parent index, has sector bands.  The MSCI USA Minimum Volatility Index’s recent sector weights were financials (22%), health care (20%), information technology (15%), and consumer staples (15%).  [According to iShares.com]

The top 10 holdings for the S&P 500 Low Volatility Index include Campbell Soup (CPB) and Coca-Cola (KO).  In contrast with the S&P 500, exposure to information technology in the S&P 500 Low Volatility Index is limited (at 2.8%), and there are currently no energy holdings.  The S&P 500 Low Volatility Index was down 2.4% year-to-date as of Feb. 3, 2016.

Meanwhile, the S&P 500 Dividend Aristocrats® currently holds 50 constituents from the S&P 500. The methodology for the S&P 500 Dividend Aristocrats requires that its constituents have increased their dividends for the last 25 consecutive years.  The index is rebalanced on a quarterly basis, though companies enter or exit on an annual basis.  Some current constituents, including Hormel Foods (HRL) and Johnson & Johnson (JNJ), have increased dividends for more than 45 consecutive years.

As of January 2016, relative to the S&P 500 Low Volatility Index, the weights of consumer staples (27%) and energy (4%) in the S&P 500 Dividend Aristocrats were higher, while financials (11%) and utilities (2%) were lower.  The S&P 500 Dividend Aristocrats has declined 2.7% year-to–date, as of Feb. 3, 2016.

The methodology for a third subset of the S&P 500 Index, the S&P 500 Low Volatility High Dividend Index, combines two defensive factors.  The index seeks to include the 50 least-volatile, high-dividend-yielding securities in the S&P 500 and is rebalanced on a semiannual basis.  The methodology for the S&P 500 Low Volatility High Dividend Index recognizes companies for their yield, but not the longevity of payments.

As such, it is no surprise that the utilities sector (25% of assets) is overweighted relative to other S&P 500-based sub-indices, while health care (7%) is underweighted.  Financials (19%) and consumer staples (17%) are other heavily-weighted sectors.  HCP Inc. (HCP) and TECO Energy (TE) are two of the current holdings.

The S&P 500 Low Volatility High Dividend Index was up 0.2% year-to-date through Feb. 3, 2016. (note, this is what I pulled on Feb 4 from the SPDJI website)

There are ETFs available that track these factor-based indices.  S&P IQ Global Markets Intelligence Group provides research and rankings on approximately 1,100 ETFs on a daily basis.  To learn more, visit http://trymsatoday.com/ or follow me on Twitter @ToddSPGlobal.

My colleague, Sam Stovall, U.S. Equity Strategist for S&P IQ Global Markets Intelligence Group, will be speaking at an S&P Dow Jones Indices event titled “Where Can Smart Beta Take You?” on Feb. 24, 2016.  You can register for the live streaming or in-person event.

S&P IQ Global Markets Intelligence Group operates independently from S&P Dow Jones Indices.

All information as of [February 4]

—————————————————————————————————–

S&P Capital IQ operates independently from S&P Dow Jones Indices.
The views and opinions of any contributor not an employee of S&P Dow Jones Indices are his/her own and do not necessarily represent the views or opinions of S&P Dow Jones Indices or any of its affiliates.  Information from third party contributors is presented as provided and has not been edited.  S&P Dow Jones Indices LLC and its affiliates make no representations or warranties of any kind, express or implied, regarding the completeness, accuracy, reliability, suitability or availability of such information, including any products and services described herein, for any purpose.

The posts on this blog are opinions, not advice. Please read our Disclaimers.