Get Indexology® Blog updates via email.

In This List

Why Choosing Between Managers Requires a Two-Dimensional View - Part 2

The Sources of Volatility and the Challenge for Active Management

Oil Prices Falling At An Alarming Rate

Where Can Smart Beta Take You? Our FA Forum Is Coming to an Internet Near You

Why Choosing Between Managers Requires a Two-Dimensional View - Part 1

Why Choosing Between Managers Requires a Two-Dimensional View - Part 2

Contributor Image
Raewyn Williams

Director of Research & After-Tax Solutions

Parametric™ Australasia

Part 1 of this article looked at the ways in which superannuation funds and other institutional investors build “multi-manager” equity portfolio structures in an attempt to spread the benefits of diversification within, and not just across, asset classes.  We noted that, astonishingly, the performance track records of managers are typically compared only on a pre-tax basis, despite the fact that earnings from investments by most investors in Australia are subject to tax.

We turn now to show how this pre-tax focus can mislead superannuation funds and other investors.  In Exhibit 1, we present the 10-year excess returns (alpha) of 198 U.S. mutual fund managers over a period ending Dec. 31, 2013, from the perspective of an Australian complying superannuation fund.  We will explain the colored data points later.

Capture

Funds above 0% on the y-axis (plotted between -6% and 6%) appear to have outperformed by generating returns in excess of the 4.84% per year benchmark return we used over the 10-year period.  Those high on the y-axis indicate the most outstanding strategies based on performance track record.  The y-axis is typically the only kind of performance information considered when evaluating strategies and choosing between alternative managers.

That approach misses a significant point.  It is also important to consider the x-axis, which shows the tax cost of achieving the managers’ pre-tax excess returns.  It is concerning to think that many institutional investors and advisors take a “one-dimensional view.”  By fixating on the y-axis, which focuses only on pre-tax performance, they are not considering the important dimension of tax (the x-axis), which can give these decision makers a much more complete picture of each manager’s performance.  A few forward-thinking institutions have the ability to focus solely on pre-tax manager returns, because they employ a sophisticated overlay approach to tax management (centralized portfolio management), but most do not have that luxury.

Without a “two-dimensional” after-tax view of manager performance it is hard to see that:

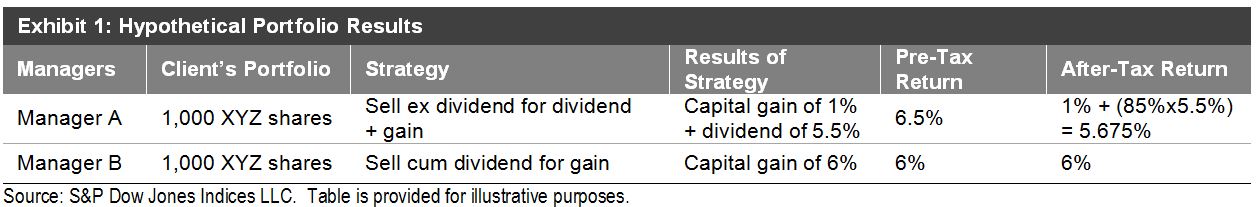
  • Strategies and managers that look similar pre-tax can look different on an after-tax basis—this is illustrated by comparing the two funds highlighted in black in Exhibit 1;
  • Strategies and managers that look like they are adding value can actually erode wealth on an after-tax basis—this is illustrated by the funds highlighted in green in Exhibit 1; and
  • A strategy or manager that looks superior to another strategy pre-tax can actually be inferior when compared after tax—this is illustrated by comparing the two funds highlighted in purple in Exhibit 1. The fund that generated an annual pre-tax excess return of 3.60% (compared to its competitor that returned 3.09%) in fact returned only 2.88% after tax, which is less than the 2.98% after-tax return of its competitor.

The simplistic one-dimensional analysis of the performance histories of the complete set of funds shows that 132 of the 198 funds outperformed the broader market; that is, generated positive pre-tax alpha.  This looks like good news.  However, the two-dimensional analysis, factoring in tax, shows that only 99 (about one-half of the funds) actually added value above market.  So, in fact, the news is not quite so good, and it is certainly not good for a superannuation fund invested in one or more of the 33 managers whose performance looked healthy pre-tax but performed no better or worse than the market on an after-tax basis.

This is a cautionary message for superannuation funds and advisors engaging in the important task of choosing investment managers to achieve the right multi-manager and strategy mix: always check that performance is evaluated with the investor’s tax profile in mind and beware of traditional pre-tax analyses and their potential to mislead.

The posts on this blog are opinions, not advice. Please read our Disclaimers.

The Sources of Volatility and the Challenge for Active Management

Contributor Image
Craig Lazzara

Former Managing Director, Index Investment Strategy

S&P Dow Jones Indices

If we needed a reminder of the continuing volatility of the world’s financial markets, the first weeks of 2016 obliged us by providing one.  What’s often overlooked, especially when volatility spikes, is that there are two distinct sources of volatility.  Understanding them can not only enhance our appreciation of market dynamics, but also provides some important insights for portfolio managers.

The two components are correlation and dispersion.  Correlation, the more familiar of the two, is a measure of timing.  Correlations within an equity market are, in our experience, invariably positive, indicating that stocks tend to move up and down together.  As correlations rise and diversification effects diminish, the co-movement of index components is heightened, and market volatility increases.

Dispersion, on the other hand, is a measure of magnitude: it tells us by how much the return of the average stock differs from the market average.   In a high dispersion environment, the gap between the market’s winners and losers is relatively large.  Given positive correlations, as dispersion rises, the market’s gyrations will take place within wider bands — and volatility will increase.

The chart below illustrates the cross-sectional interaction of dispersion, correlation, and volatility using the sectors of the S&P 400.

400 sector correlation and dispersion_1232115

The numbers in parentheses show the last 12 months’ volatility for each sector.  Energy, unsurprisingly, was the most volatile sector, driven largely by its very wide dispersion.  The Financials sector was the index’s least volatile.

Notice that the volatility of Utilities (17.4%) and Health Care (17.0%) were more or less the same.  Yet their volatility came from different sources.  Utility volatility is correlation-driven; the gap between the sector’s winners and losers is low, producing low dispersion, but the winners and losers are highly likely to move together, producing high correlation.  Health Care’s volatility comes from the opposite direction — from low correlation, meaning that the sector’s components tend to move more independently, but with higher dispersion, indicating a bigger gap between winners and losers.

The sources of sector volatility have important implications for active managers:

  • For a sector like Utilities, stock selection should be a relatively low priority.  Low dispersion means that the gap between winners and losers is relatively low; this reduces the value of an analyst’s skill.
  • For Health Care (and other high-dispersion sectors), the situation is different — the opportunity to add (or to lose) value by stock selection is relatively large.  If research resources are constrained, this is where they should be concentrated.
  • The nature of the research question is fundamentally different for these two sector types.  For Utilities, the sector call is important, the stock selection decision much less so.   For Health Care, the stock selection decision is more critical.

An investor who understands the sources of volatility is more likely to be successful at managing and exploiting it.

The posts on this blog are opinions, not advice. Please read our Disclaimers.

Oil Prices Falling At An Alarming Rate

Contributor Image
Jodie Gunzberg

Former Managing Director, Head of U.S. Equities

S&P Dow Jones Indices

In yesterday’s note (on Jan. 11, 2016 that used closing data as of Jan. 8, 2016), I stated that the oil market is falling at an alarming rate, and I guess I was right. That is the reason I’m posting an update today. Normally, I don’t update the posts from day to day; however, today, something I said yesterday changed very quickly:

“The concern is for futures investors that need to pay rolling costs.  The S&P GSCI Crude Oil Excess Return that includes rolling costs is down far past a 2004 low, reaching its lowest since Feb 1999, and is on the verge of another multi-year loss. If the S&P GSCI Excess Return loses just another 5.5%, it will shed another 5 years of gains.”

After a 2-day loss of 8.2% in the S&P GSCI Excess Return index, that Feb 1999 bottom is history… Now the index blew through the 1999 bottom, and intraday broke the 1994 bottom to set the index all the way back to the lowest level seen since March of 1989. That is a 27 year low. During the day, the index recovered but is now flirting with and is only 55 basis points away from that 1989 level.

The index only goes back to 1987 and here is the new picture:

Source: S&P Dow Jones Indices

Someone today asked whether this is a good thing for the rebalance that is increasing the (WTI) crude oil weight not just 3.4% from the relative loss (to other commodities) but an additional 2.1% from the new world production weights for 2016.  It depends how you look at it. Maybe like catching two falling knives or getting the steal of a lifetime…

If this drop is like the 2008-9 drawdown then oil needs to fall to about $27; however, with the supply like the 80’s and the Chinese demand slowdown like the global financial crisis combined, this period may be worse.

The posts on this blog are opinions, not advice. Please read our Disclaimers.

Where Can Smart Beta Take You? Our FA Forum Is Coming to an Internet Near You

Contributor Image
Shaun Wurzbach

Managing Director, Head of Commercial Group (North America)

S&P Dow Jones Indices

I am excited about our Miami Financial Advisor Forum, “Where Can Smart Beta Take You?”  This educational event will occur at the Epic Hotel in Miami on Feb. 24, 2016.  For the first time, we will livestream this financial advisor forum.  We hope that by broadening access to this event, more of you will find it possible to partake.

As our title suggests, this FA Forum is geared toward smart beta or factor-based investing.  We divided our smart beta education and thought leadership into three areas of interest:  The Practitioners, the Gurus, and the Strategist.

The Practitioners: Four eminent financial advisors representing large, successful RIA and Wirehouse firms will discuss how they evaluate smart beta and implement it into client portfolios.

  • Combining smart beta with traditional indexing and the alpha that the advisor as a portfolio manager can generate at the asset-allocation level.
  • Different ideas for evaluating and incorporating smart beta into client portfolios to position for growth and opportunities.
  • Ways that smart beta can help to manage downside risk or balance risk across asset classes.

The Gurus: The future of smart beta from three of the pioneers who started it.  Tom Dorsey, co-founder of Dorsey, Wright & Associates, Jason Hsu, co-founder of Research Affiliates, and Ben Fulton, CEO of Elkhorn Investments, will tell us what to expect and where we are headed with smart beta.

  • Using smart beta and tactical approaches together and how factors are being combined in new index-based products.
  • How new smart beta ideas originate and the ways that these ideas are brought to market.
  • Applying fundamental weighting in indices across all asset classes.
  • The relevancy of newly indexed factors such as CAPEX to returns and risk.

The Strategist: Sam Stovall, Equity Strategist at S&P Capital IQ/SNL will share how smart beta works with some of his “7 Rules of Wall Street.”

  • The historic outperformance of strategies incorporating the S&P Dividend Aristocrats Series as a factor-based approach to growing dividends.
  • Using readily available smart beta index data to keep investment strategies relevant.
  • Use of low volatility in lieu of cap weighting as a defensive alternative.

I hope that you will join us for this forum—in person, or virtually.  It will be a unique opportunity to learn about strategies using smart beta, best practices for incorporating smart beta in portfolios, and where smart beta may take us in the future.

Livestreaming invitation

In-person invitation

The posts on this blog are opinions, not advice. Please read our Disclaimers.

Why Choosing Between Managers Requires a Two-Dimensional View - Part 1

Contributor Image
Raewyn Williams

Director of Research & After-Tax Solutions

Parametric™ Australasia

For large superannuation funds and other investors with institutional-sized portfolios, a common practice is to spread the allocation to a particular asset class among a number of managers within a “multi-manager” structure.  This provides the benefits of diversification not only across asset classes, but also within key allocations like Australian and global equities.  The aim of good manager selection is to construct an optimal style blend, noting that no one style is likely to perform well in all market conditions.

Manager research and selection is a specialist skill that requires a comparison of alternative managers across an array of attributes, especially their performance “track record.”  It is well accepted that past performance is no predictor of future results, so other attributes to be considered typically include each manager’s credentials, experience, fees, structures offered, technology, research pedigree, operational support, and trading efficiency.  Large superannuation funds will typically engage an asset consulting firm to assist them with manager research and may also subscribe to surveys and publications that report and rank manager performance.

Because so much attention is paid to managers’ performance track records, the way that performance is measured and compared by funds and advisors is important.  Yet, there is a vital piece of the picture missing, a concept that is continually overlooked when assessing managers’ performance: taxes.  Superannuation funds, like most investors, are subject to taxes on investment performance, and what really matters is “what members and investors eat” in the form of after-tax returns.  In an ideal world, it would be reasonable to assume that manager performance is, as standard practice, measured and compared on an after-tax basis.  Unfortunately, this assumption is wrong.

Consider two hypothetical international equity managers holding the same stock from the perspective of a taxable superannuation fund client with realized capital losses (see Exhibit 1).

Capture

In this scenario, a pre-tax focus tells the client that manager A is superior to manager B.  When faced with a reason to change the investor portfolio, the client is (in the absence of other differences) more likely to withdraw money from manager B than manager A, or terminate the mandate altogether.  Yet, viewing each manager’s performance through an after-tax lens shows that manager B has been more successful at building wealth for the superannuation fund client.

In part 2 of this article, we move from the hypothetical to an actual 10-year performance history of 198 U.S. managers.  We depict the “one-dimensional” view by plotting the pre-tax performance of these managers along a y-axis where seemingly “superior” managers rise to the top.  We then create a “two-dimensional” view by plotting these managers’ performance on an after-tax basis along an x-axis to show how truly revealing a two-dimensional view of manager performance can be.

The posts on this blog are opinions, not advice. Please read our Disclaimers.