Get Indexology® Blog updates via email.

In This List

India: Market Update for Q3 2015

Terror Attack On Paris May Shift The Oil War

ETF industry in India over the years

Is China a Building Block in Your Portfolio?

Active Versus Passive Through Municipal Bonds

India: Market Update for Q3 2015

Contributor Image
Mahavir Kaswa

Former Associate Director, Product Management

S&P BSE Indices

Key highlights of the past quarter that ended Sept. 30, 2015 were the continued fall in wholesale and retail inflation, the devaluation of the yuan and the subsequent reduction in interest rates by the Chinese government, the Fed keeping interest rates the same, and the reduction in the repo rate by the Reserve Bank of India (RBI).  Amid all these events, the third quarter of 2015 was weak for Indian markets, with India’s broad market index, the S&P BSE AllCap, posting a loss of 3.1% and the S&P BSE SENSEX declining further, at -5.4% (please see Appendix for a market heat map and monthly total returns).

During July 2015, most of the benchmark indices posted gains, and the S&P BSE MidCap and the S&P BSE SmallCap outperformed the S&P BSE LargeCap.  In August 2015, the Chinese government devalued the yuan to remain competitive in exports; the surprise move created apprehension in the global markets, resulting in a depreciation of various emerging market currencies.  August 2015 was the worst month of the third quarter, as all size and sector benchmark indices (except for the S&P BSE Information Technology and S&P BSE Healthcare) posted negative returns.  However, in September 2015, the Fed’s decision not to change its interest rates and the RBI’s decision to reduce its interest rate (the repo rate) by 50 bps helped the S&P BSE SENSEX to recover from its quarterly low of 24,833.54, as it closed marginally lower than the previous month, posting a return of -0.4%.

Within benchmark size indices, the S&P BSE MidCap was the best-performing index, with a total return of 1.9% during the quarter.  Large-cap stocks were the worst performing, with the S&P BSE LargeCap posting a return of -4.9% during the same period.  The S&P BSE SmallCap posted a marginal gain of 0.1% during the third quarter of 2015.

AllCap Exhibit

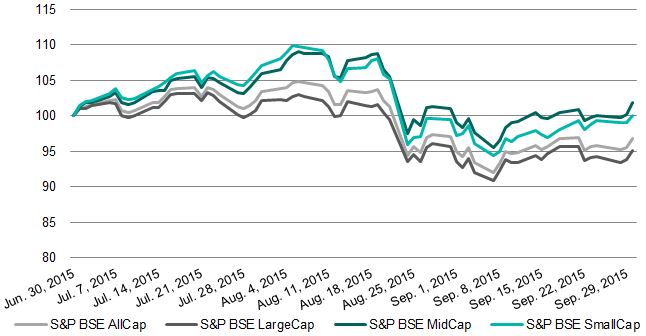
Source: Asia Index Private Limited.  Index performance based on total return in INR.  Data from June 30, 2015, to Sept. 30, 2015.  Past performance is no guarantee of future results.  Chart is provided for illustrative purposes.

To read the full Report, please click here.

The posts on this blog are opinions, not advice. Please read our Disclaimers.

Terror Attack On Paris May Shift The Oil War

Contributor Image
Jodie Gunzberg

Former Managing Director, Head of U.S. Equities

S&P Dow Jones Indices

Geopolitical developments often have a major impact on oil prices since they can affect oil supply directly and since the threat of future supply disruptions can also build a risk premium into oil prices. As a notable example, in the early part of 2014, conflicts in Libya and Iraq led to temporary outages in their oil production, keeping world prices high, even as supply elsewhere in the world continued to ramp up. When production from those two countries came back on stream, that was an important trigger for the plunge in oil prices later in the year.  Notice how much oil price spiked at the historical times of war.

Source: S&P Dow Jones Indices

While the S&P GSCI Crude Oil only is recorded since 1987, below is a chart that goes back to 1947 by WTRG Economics that shows spikes in oil price jumped more than 2 times on average during critical periods of conflict, including the Iran/Iraq War, Iranian Revolution, Yom Kippur War and Oil Embargo.

War Oil History

Generally, when there is a war, commodities perform well since it takes resources to fight a war and people will continue to drink coffee and eat cereal, which is the kind of fundamental economic diversification that makes this asset class important. For example, below is a graph of the S&P 500® versus the S&P GSCI during the Persian Gulf War that shows while stocks dropped, commodities rose.

Source: S&P Dow Jones Indices

In the recent environment, OPEC is committed to maintaining market share in the global oil markets. Shortly after the natural gas deal was signed between Russia and China, OPEC started flooding the market with oil to drop the price so marginal producers exited. This also happened in the 1986 period when OPEC dropped the price from $32/bbl to $10/bbl which may have led to the breakup of the Soviet Union. The current low oil price has divided the world by importers, exporters, developed and emerging markets

Now, just as the world is agreeing on a chance for structural reform, the picture may change again. The ISIS attack on Paris might be the catalyst to change OPEC’s oil market policy of defending market share. Saudi Arabia may need to alter their focus to support defensive measures rather than maintaining oil market share. There is a pivotal question about whether Saudi protects the long-term value of oil reserves or if they defend their role as the pre-eminent Sunni power in the region… both are important.

On a different note, the other major commodity associated with war is gold, as it is known for its role as a safe haven in times of market crises. Using rolling 12-month returns (monthly year-over-year) from Jan 1979 – Sep 2015 of the S&P 500, the result shows that whether there was a bull, bear or flat stock market, gold was positive at least half the time. The stock market condition didn’t necessarily say anything about gold returns, but gold performed well when there were bear market conditions. It was positive the highest percentage of the time, 74%, in bear markets that lost more than 20%, and on average gold gained 6.5% historically in this condition.

Source: S&P Dow Jones Indices

Since most single factors like inflation, interest rates, jewelry demand, oil prices, geopolitics and U.S. dollar strength don’t alone move gold, they are unreliable indicators of gold’s prices. However, one statistic that is pretty solid through time is that gold is uncorrelated to the stock market. On average, the 12- month correlation is zero but even on short intervals of rolling 90 days the correlation doesn’t ever exceed 0.6.

Source: S&P Dow Jones Indices

Based on this, the case can be made that gold has protected in down markets and has been a good diversifier.

In conclusion, despite the tragedy of the attack on Paris, commodities may help investors diversify through this difficult time. Oil prices have historically spiked in times of crisis, and with the production dilemma on the table for OPEC, Saudi may need to reallocate resources to national defense. There may be a demand reduction from the crisis but not enough to offset supply issues. This holds true for agriculture and livestock as well, that are more highly impacted by weather and may benefit from El Niño in the near future. Additionally, gold may also hold its role as a diversifier as it has in the past during stock market crises.


The posts on this blog are opinions, not advice. Please read our Disclaimers.

ETF industry in India over the years

Contributor Image
Utkarsh Agrawal

Associate Director, Global Research & Design

S&P Dow Jones Indices

It is well known that diversification lowers the risk. For example, say we want to travel from one place to another. We can take a bus. What if the route on which the bus plies is blocked for some reason? We can consider taking another bus which travels on a different route. What if all the bus operators are on strike? We can consider taking a taxi. What if all the taxi operators are also on strike? We can consider travelling by train. By keeping the options open or diversifying the modes of travel we are trying to reduce the risk of not being able to reach the destination. Investors can also use the power of diversification to lower their investment risks. Exchange traded funds (ETFs) are a means by which investors can diversify their investments across a range of asset classes or to pursue investment strategies.  In India in recent years the number of ETFs offered and assets under management have increased, except for gold ETFs.

In the capital markets, investors can pick and choose a security or invest in a basket of securities that is diversified, meaning the securities are expected to move up and down under different market conditions. Of course, the inherent risk of investment loss would be lower for the basket than for a single security. However, monitoring a basket involves much more effort in comparison to a single security. Hence the mutual fund industry was born where investors were able to pool their money and let the professionals manage it for a fee, and reap the benefit of diversification. At the same time, investors were also liberated from the chore of monitoring the basket.

The mutual fund industry can again be divided into active funds versus index funds, which is a passive investment style. In the active space the manager makes active investment decisions on stocks in an effort to generate alpha. However in an index fund, the manager simply attempts to replicate an index with minimum tracking error. The benefit of index fund is lower expense ratio due to lower management fees. As the markets evolved, investors realized that mutual funds, whether active or index, are not tax efficient since the capital gains realized on the sale of fund investments, including to meet redemption requests, is distributed across all the existing investors based on fund ownership.

Exchange traded funds (ETFs) were invented to be more tax efficient in addition to having lower expense ratios than mutual funds. As the name suggests, ETFs are traded on the stock exchanges throughout the day, unlike the mutual funds which are purchased or redeemed only on an end of day basis. With the introduction of ETFs, the smaller investors were able to gain access to some of the asset classes that were previously accessible to only the institutional investors. ETFs also have helped in the price discovery of some of the less liquid asset classes. The most noteworthy feature of an ETF is transparency as the underlying securities and their quantities held are declared on a daily basis.

ETFs were first listed in developed nations in early 1990s and have grown tremendously in terms of the number of ETFs listed as well as the assets under management. In India the first ETF was listed in the year 2002. Since then the number has gone up to 49 as of June 30, 2015 (see Exhibit 1).

Exhibit 1: Total Number of ETFs in India. Date as of June 30, 2015

ETF Exhibit 1

Source: S&P Dow Jones Indices, Morningstar, Association of Mutual Funds of India, Factset and Bloomberg 

It is interesting to note that in India the presence of ETFs is not in one but four different asset classes and the two major categories are equities and commodities. The equity ETFs are primarily large cap with some focusing on mid cap and financial sectors. The entire commodity ETFs are based on gold.

From Q2 2006 through Q4 2007, the quarterly asset under management in the equity ETFs soared and reached INR 73.83bn in Q4 2007 (see Exhibit 2). Since then it declined during the recession and reached the lowest at INR 4.01bn in Q2 2009. The asset under the management again started picking up since Q2 2014. This can be attributed to the improved market conditions as well as the introduction of the CPSE ETF which comprises almost 36% of the assets within the equity ETFs as on June 30, 2015.

Gold has been one of the popular investment options amongst the Indians as a store of value. From Q2 2009 onwards, gold ETFs have had the highest share of the quarterly average assets reaching INR 118.52bn in Q1 2013 (see Exhibit 2). Since Q2 2013, the asset under management in gold ETFs have declined by more than half due to various reasons such as strengthening of dollar, lesser demand for gold in domestic market due to import restrictions, amongst others.

There is only one fixed income ETF focusing on 10 year Indian government bonds and one liquid ETF. The fixed income ETF is relatively new while the money market ETF has been there since 2003.

Exhibit 2: Quarterly average asset under management of ETFs in India. Date as of June 30, 2015

ETF Exhibit 2

Source: S&P Dow Jones Indices, Morningstar, Association of Mutual Funds of India, Factset and Bloomberg

The liquidity profiles of the ETFs also reveal some interesting facets of this industry. Historically the gold ETFs combined have remained most liquid followed by money market ETF. But in more recent times, money market ETF has been the most liquid ETF and equity ETFs combined have been the second most liquid ETFs (see Exhibit 3). During 2011 through 2012, gold ETFs were aggressively pursued by the investors. In Q3 2011, the combined quarterly average daily value traded of the gold ETFs was more than INR 800mn. Since Q2 2013, the liquidity has reduced which is also augmented by the fact that the asset under the management have declined since then.

Exhibit 3: Average daily traded value of ETFs in India. Date as of June 30, 2015

ETF Exhibit 3

Source: S&P Dow Jones Indices, Morningstar, Association of Mutual Funds of India, Factset and Bloomberg

The ETF industry in India has been very dynamic over the years and it is still growing. Unlike some of the developed nations where active ETFs also exist, India only has passive ETFs. Indices play a major role in the functioning of the passive ETFs which simply try to mirror the benchmark index they are based on. With more and more investors becoming aware of the potential advantages of this investment product, it will continue to grow and help investors in their quest for diversification with lesser cost and tax efficiency.

The posts on this blog are opinions, not advice. Please read our Disclaimers.

Is China a Building Block in Your Portfolio?

Contributor Image
Ellen Law

Former Associate Director, Asia Pacific Market Development

S&P Dow Jones Indices

After China’s stock plunge in Q3 2015, many investors have had two different views toward China.  The bearish camp avoids buying Chinese stocks, as they think the Chinese market is volatile, and that the earlier stock market bubble has not fully burst when it comes to the problems of shadow banking, margin lending, and an overheating property market.  The bullish camp holds a different view, claiming that Chinese stocks are cheap now and that the panic sell-off had been exaggerated.  It claims that the valuation of China is getting lower, which presents a potential buying opportunity, especially for long-term investors.

No matter which view you take, either bearish or bullish on China, one cannot simply ignore China, considering its size and importance in the world economy and long-term economic growth.  For this reason, it may not come as a surprise that some indices and investment products were launched for a pure play in China after the recent sell off, such as the S&P China 500, which seeks to track all Chinese share classes, including A-shares and offshore listings.

Alphabet Soup of Chinese Share Classes
To capture the complete Chinese story, investors may invest in different Chinese share classes.  However, Chinese share classes are often seen by foreign investors as being quite complex.  A-, B-, H-, L-, N-, and S-shares are just like the different letters mixed in alphabet soup.  In reality, only a handful of share classes, namely A-, H-, and N-shares, represent around 99% of the total market capitalization of the Chinese equities market.  A-shares are Chinese companies trading on the Shanghai and Shenzhen exchanges in renminbi.  International access to these domestic shares has been limited, but they have become more open due to the market liberalization supported by the Chinese government.  H-shares are similar to A-shares, but they trade on the Hong Kong Stock Exchange in Hong Kong dollars.  They are open to international investors without any restriction.  N-shares are Chinese companies trading on the New York Stock Exchange and NASDAQ in U.S. dollars.  Some of them are fast-growing internet and technology stocks, such as Alibaba and Baidu.  For the list of Chinese share classes, please refer to Exhibit 1.

Capture

Liberalization of China’s A-Share Market
It is worth noting that the historically restricted A-share market has now been made more readily available to international investors, and thanks to the launch of the Qualified Foreign Institutional Investor (QFII), Renminbi Qualified Foreign Institutional Investor (RQFII), and Shanghai-Hong Kong Stock Connect (Stock Connect) programs, both QFII and RQFII allow approved applicants to access to the A-share market via a quota system.  The total QFII and RQFII quotas have reached USD 78.97 billion and RMB 419.5 billion (USD 66.3 billion), respectively.[1]  The Stock Connect is a significant measure that links the Shanghai and Hong Kong stock exchanges, allowing mainland Chinese investors to purchase selected eligible shares listed in Hong Kong, and, at the same time, letting foreign investors (both institutional and retail) buy eligible Chinese A-shares listed in Shanghai.  The Stock Connect is expected to expand to the Shenzhen stock exchange soon, since both the Hong Kong and Shenzhen bourses have said the launch preparations had been completed and were waiting regulatory approval.

[1]   State Administration of Foreign Exchange, data as of Oct. 29, 2015.

The posts on this blog are opinions, not advice. Please read our Disclaimers.

Active Versus Passive Through Municipal Bonds

Contributor Image
Todd Rosenbluth

Director of ETF and Mutual Fund Research

S&P Capital IQ Equity Research

Municipal bond mutual funds gathered USD 2.8 billion in the four-week period ending Oct. 28, 2015, according to the Investment Company Institute, while muni bond ETFs added USD 593 million of inflows in October, according to SSGA.  Despite this low number, at the recent S&P Dow Jones Indices Municipal and Global Bond Forum, various panelists highlighted the relative benefits of municipal bond ETFs.

For example, J.R. Rieger, Managing Director of Fixed Income Indices for S&P Dow Jones Indices, highlighted that just one-third of all active national municipal bond funds outperformed the S&P Municipal Bond Index in the three-year period ending June 2015.  Further, just 16% of those funds that were in the top-quartile of their muni bond peer group in the 12-month period ending March 2013 retained that ranking in the subsequent period.  Both observations come from S&P Dow Jones Indices Index versus Active and Persistence Scorecard.

Similarly, a fellow panelist at the S&P Dow Jones Indices forum acknowledged one advantage index-based ETFs have over active mutual funds is explicit parameters that are not subject to a manager’s view of the world.  We think a look at a popular active New York municipal bond fund compared to an S&P Dow Jones index makes this point clear.

The S&P New York AMT-Free Municipal Bond Index consists of investment-grade general obligation bonds and essential purpose revenue bonds issued within New York.  As of the end of October 2015, 99% of the bonds were rated ‘A’ or higher by Standard & Poor’s Ratings Services.  Meanwhile, Oppenheimer Rochester AMT-Free New York Municipals (OPNYX) has a 20% stake in Puerto Rico bonds that incur greater credit risk in exchange for a higher yield, as of September 2015.

Bonds issued by Puerto Rico are exempt from federal, state, and local income taxes for individual investors.  In September 2015, Standard & Poor’s Ratings Services downgraded Puerto Rico-backed debt to ‘CC,’ citing that the bonds are highly vulnerable to nonpayment.

A separate difference between municipal bond ETFs and mutual funds is that ETFs trade on an exchange, allowing investors the liquidity to make intra-day trades.  Yet, at the same S&P Dow Jones Indices’ forum, a panelist reminded attendees that municipal bond ETFs net asset values (NAVs) are a best estimate.  Unlike Treasury bonds, it is rare for muni bonds to trade on a daily basis.  As such, according to our research, muni ETFs that hold these securities can, at times, trade at relatively wider premiums or discounts compared with NAVs.

S&P Capital IQ has researched 33 municipal bond ETFs, 22 of which have price/NAV premiums or discounts greater than 10 bps.  Meanwhile, just two of the 22 U.S. Treasury ETFs trade as widely relative to their net asset value.

—————————————————————————————————–

S&P Capital IQ operates independently from S&P Dow Jones Indices.
The views and opinions of any contributor not an employee of S&P Dow Jones Indices are his/her own and do not necessarily represent the views or opinions of S&P Dow Jones Indices or any of its affiliates.  Information from third party contributors is presented as provided and has not been edited.  S&P Dow Jones Indices LLC and its affiliates make no representations or warranties of any kind, express or implied, regarding the completeness, accuracy, reliability, suitability or availability of such information, including any products and services described herein, for any purpose.

The posts on this blog are opinions, not advice. Please read our Disclaimers.