Get Indexology® Blog updates via email.

In This List

Rising Rates' Silver Linings

How Did European Active Managers Perform Over the Past 10 Years?

Losing My Religion: Value in the USA

The Rieger Report: Puerto Rico - a 22% Weight on the High Yield Muni Market

DJSI: A Journey Toward Sustainability and Beyond

Rising Rates' Silver Linings

Contributor Image
Fei Mei Chan

Former Director, Core Product Management

S&P Dow Jones Indices

Bond values will, definitionally, fall when interest rates rise. However, different types of bonds have differing characteristics.

The chart below shows the annual performance of the S&P 500 Bond Index and the S&P/BG Cantor 7-10 US Treasury Bond Index. (The S&P/BG Cantor 7-10 US Treasury Bond Index is the treasury index most similar to the S&P 500 Bond Index in duration and yield.) Notably, the performance of corporate debt and Treasuries diverged in the 2008 financial crisis and the recovery thereafter.

Rising Rates' Silver Linings1

As between the S&P 500 Bond index and the S&P/BG Cantor 7-10 US Treasury Bond Index, the former is much more correlated to the S&P 500, 0.256 versus -0.194, respectively. This is not surprising, since corporate debt carries a higher risk than Treasuries. When crisis is such a threat that corporations’ survival is at peril then naturally debt issued by corporations will also be in danger of default.

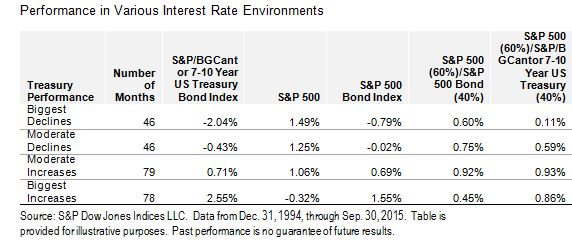
The two bond indices also had varying performance profiles in increasing and declining interest rate environments. Between 1995 and 2015, the months when Treasuries delivered their worst performance were the months when corporate bonds outperformed Treasuries by the largest spread (see table below). We divided the 249 months in this period into modified quartiles based on whether the S&P/BGCantor 7-10 Year US Treasury Bond Index was positive or negative and then further divided those months equally into the biggest and moderate changes in each direction. In the worst quartile for Treasuries, an average monthly decline of 2.04%, the S&P 500 Bond Index’s average decline was only 0.79%, an outperformance of 1.24%. In those same months, an archetypal 60/40 allocation with corporate bonds yielded outperformance of 0.49% versus one with Treasuries.

Rising Rates' Silver Linings2

Heightened sensitivity to anticipated interest rate increases is understandable. However, the impact of interest rate changes varies with different types of bonds. Historically, when interest rates rose, their effect on corporate bonds have been muted compared to that of Treasuries. Similarly, a balanced allocation incorporating corporate bonds has offered more protection relative to Treasuries during these times.

The posts on this blog are opinions, not advice. Please read our Disclaimers.

How Did European Active Managers Perform Over the Past 10 Years?

Contributor Image
Daniel Ung

Former Director

Global Research & Design

Like in recent years, Greece has yet again dominated the European headlines for most of this year.  Contagion effects have been somewhat contained, thanks to a more solid European economy and financial system.  Nevertheless, the market has experienced bouts of heightened volatility, especially in June 2015 when the Greek authorities decided to shut their banks down to stem a potential liquidity crisis in the country.

Given this backdrop, we have decided to compile data on the 10-year performance of European active managers for the first time, and here are the results.

EUROPE

  • Over the one-year period, 55% of the euro-denominated active funds invested in European equities lagged their respective benchmarks.
  • This level of underperformance was even more acute over the longer term. When viewed over a 10-year period, about 92% of actively managed eurozone equity funds trailed their respective benchmark.

For more information, you can access the full report via this link.

Capture

The posts on this blog are opinions, not advice. Please read our Disclaimers.

Losing My Religion: Value in the USA

Contributor Image
Tim Edwards

Managing Director, Index Investment Strategy

S&P Dow Jones Indices

If simple is beautiful, then value investing is the equity market’s Helen of Troy – the faith that launched a thousand funds.  If a company’s assets or profits are high in relation to its share price, it does not require much imagination to suppose that such company might offer attractive long-term investment prospects.

Value is also a “smart beta,” having been indicized – the concept of overweighting companies whose stock price is relatively cheap compared to their fundamentals underlies a swathe of indices, many of which have gained a broad traction with investors.

Value – the theory goes – works most of the time in the long term, and some of the time in the short term.  As far as the U.S. markets are concerned, at the very least, an increasing degree of patience may be required.

But is “value” still working?

This is both an easy and a difficult question to answer.  First, the easy answer.  S&P Dow Jones Indices encodes value in several different U.S. based indices, reflecting the priorities of various different value investing schemes.  We can examine the performance of these various value strategies, in comparison to an appropriate benchmark, over the long and short term.  Such performance comparisons can also test the support for the various theses – such as the hope that value investments will weather crises more steadily – that are used in support of value investing as a style.  The charts below show the relative performance of four value indices based on U.S. equities, over the past year and decade.

YTD

Note on reading the chart: if value is above 100%, the relevant index has outperformed its benchmark by a proportion equal to the chart level since the start date – if below, it has underperformed by that proportion.  And note that the benchmarks for relative performance vary among value indices; as we’ve indicated previously in our research on value indices, an equal weight benchmark is a better indication of the value-added by the particular index methodology.

decade

The result of such comparisons is conclusive: in both the short-term and long-term, value indices have been underperforming.

Of course, the harder question is whether value will “work” in the future.  Value investing is typically supported, at the last, with the historical fact that – in the long, long term – value investing has outperformed.  But there is always a disclaimer that the future may not reflect the past, and there is something different this time.

So, What’s New?

This difference is hinted already by the existence of our value indices: as a concept, value has become remarkably popular in recent times.  A vast bank of academic literature has been published on the subject; systematic strategies have been encoded and funded to capture it.  To give a sense of this growing popularity, the next chart shows the assets outstanding in U.S. listed ETFs that have the word “value” somewhere in their name; the growth in assets outpaces the investment growth (as proxied by the S&P 500 Value Index) by a close to a ten times multiple.

Growth in Assets in “Value” ETFs, Dec 2007 – Oct 2015

ETF AUM

With so much energy directed to exploiting the excess returns available through value investing, maybe the only “value” stocks left are the value traps, those stocks whose prices are low as their prospects are determinedly poor.  And, if the popularity of value strategies increases sufficiently to diminish future returns, investors may be better served focusing on other factors.

Like the topless towers of Ilium, investors can be burned by relying on the wrong factors.   It remains to be seen whether the returns over previous decades attributed to a “value” premium are due a comeback.  More broadly, the persistence of excess returns attributable to the kind of simple strategies that can be indicized – like value – are not guaranteed; careful analysis of persistence is a matter of great importance.

The posts on this blog are opinions, not advice. Please read our Disclaimers.

The Rieger Report: Puerto Rico - a 22% Weight on the High Yield Muni Market

Contributor Image
J.R. Rieger

Former Head of Fixed Income Indices

S&P Dow Jones Indices

As the Puerto Rico saga continues it has created a drag on the high yield municipal bond market.

The weight of Puerto Rico debt in the market place as measured the market value of bonds in select indices as of September 29, 2015:

The impact of Puerto Rico on year-to-date returns through that period is:

  • S&P Municipal Bond High Yield Index (Excluding Puerto Rico bonds): 4.42%
  • S&P Municipal Bond High Yield Index (Including Puerto Rico bonds):  0.89%

The expectations of defaults, creditor negotiations, and the uncertainty of legislation changes all make the situation fluid for the bond holders.

Learn more!  Join us on-line Wednesday October 28th as we live stream the complimentary 4th Annual Municipal and Global Bond Forum.  Click here for the agenda.


The posts on this blog are opinions, not advice. Please read our Disclaimers.

DJSI: A Journey Toward Sustainability and Beyond

Contributor Image
Manjit Jus

Managing Director and Global Head of ESG Research & Data

S&P Global

Last year the Dow Jones Sustainability Indices (DJSI) celebrated their 15 year anniversary, making them the longest running family of global sustainability indices in the world. The DJSI have been recognized as one of the most credible ratings in the world (GlobeScan / SustainAbility Survey) and have played a supporting role in leveraging sustainability as a key business driver for corporate success. The indices continue to serve as a key companion and benchmark for global companies across all industries throughout their sustainability evolution. The best-in-class approach allows companies to measure themselves directly against their peers and allows for healthy competition within an industry.  After all, no one likes coming in second place.

The DJSI rely on the information provided by companies via RobecoSAM’s Corporate Sustainability Assessment (CSA). The CSA is a unique collection of questions and criteria, addressing the most material sustainability issues within each of the 59 industries that are assessed. The wide range of topics go beyond the traditional environmental, social, and governance approach, aiming to find the intersection between what matters most to companies and investors. Topics like innovation management, customer relationship management, and tax strategy are perhaps not topics that would normally be connected to the word “sustainability,” but for RobecoSAM, these are key areas that drive long-term value creation within companies.

The information submitted by companies needs to be backed by supporting documents (audit reports or publicly available information), and the CSA process itself is audited by Deloitte. Additionally, a Media and Stakeholder Analysis (MSA) is used to monitor companies continually, ensuring that they are upholding their sustainability commitments and adhering to the principles and policies they communicate to their stakeholders.

The recent Volkswagen scandal highlights the rigorous procedures in place to ensure that the integrity of the DJSI remains intact. Potential problematic issues relating to any DJSI component company automatically trigger an MSA. Following the MSA, the Dow Jones Sustainability Index Committee (DJSIC) reviews the issue and decides whether the company will remain in the index, based on DJSI Guidelines. In Volkswagen’s case, the result was exclusion from the DJSI. DJSIC decisions are reviewed annually, and RobecoSAM maintains communication channels with the companies in question on behalf of the DJSIC to track their progress.

Like the 15-plus-year development of the DJSI, the CSA has been subject to change over the course of its 20-year life, aiming to address the emerging risks and opportunities within industries on an ongoing basis. Corporate sustainability has come a long way, and investors see sustainability not only as a means of mitigating or avoiding risks, but also for seizing new opportunities that arise. Similarly, the CSA has evolved to identify the companies that are leveraging these opportunities as new sources of value creation, while challenging them to rethink the way they communicate about sustainability.

In 2015, 864 of the world’s largest organizations participated in the CSA, investing a sizeable amount of time, effort, and manpower to ensure that the results best reflected their sustainability efforts. Beyond vying for a place in the DJSI, companies are compensated for their efforts through the feedback received from the DJSI, which is often used as a way to measure the investment community’s views on emerging sustainability issues. For instance, in 2014, the tax strategy criterion was introduced, which was initially received with mixed reactions, as companies felt this was out of context and were unable to provide answers to the questions asked. One year later, almost twice as many companies answered these questions, highlighting that the topic of tax transparency has made it onto their sustainability agenda and is being addressed by other stakeholders. RobecoSAM encourages companies to participate actively in the CSA—we see it as a playbook for embracing and adopting financially material topics, challenging them with new long-term risks and opportunities, and ultimately for finding innovative sources of competitive advantage.

Now in their 16th edition, the DJSI continue to serve as the leading global benchmark for corporate sustainability, and the collaboration between S&P Dow Jones Indices and RobecoSAM continues to provide the basis for new, cutting-edge sustainability products for investors. The CSA remains the foundation of this product development and helps corporations and investors achieve long-term value from sustainability, regardless of how far they’ve come on their own sustainability journeys.

The posts on this blog are opinions, not advice. Please read our Disclaimers.