Get Indexology® Blog updates via email.

In This List

The Fed and the Debt Ceiling

The Effects of Regulation on Prescription Drugs

Home Prices Are Rising Faster Than You Think

A Closer Look at SPIVA® India Mid-Year 2015

Energy Stocks and Bonds Say Oil May Have Bottomed

The Fed and the Debt Ceiling

Contributor Image
David Blitzer

Former Managing Director and Chairman of the Index Committee

S&P Dow Jones Indices

Two distractions creating uncertainty for the treasury market right now are the debt ceiling and who said what at the Fed. Both annoyances should fade away, one in a few weeks, the other possibly not until sometime in the first half of 2016.

The debt ceiling law dates back to shortly before the Second World War.  It covers the total federal debt; the current limit is $18.1 trillion. The Treasury Secretary says that the debt will be hit the first week in November as all the extraordinary measures to conserve cash are exhausted. Most of the time there is enough room between the current total debt and the ceiling that ceiling doesn’t matter much. However, every so often the amount of debt approaches the ceiling and Congress must pass a bill to increase the ceiling. Practically speaking lowering the debt isn’t an option. However, surpluses during the Clinton administration did somewhat reduce the debt and leave more room below the ceiling.

Since Congress must approve all tax and spending bills, it is not clear why the debt ceiling is necessary. However, the periodic debt ceiling battles give Members of Congress an excellent opportunity to complain to the government about the government – so permanently eliminating the debt ceiling isn’t too likely.

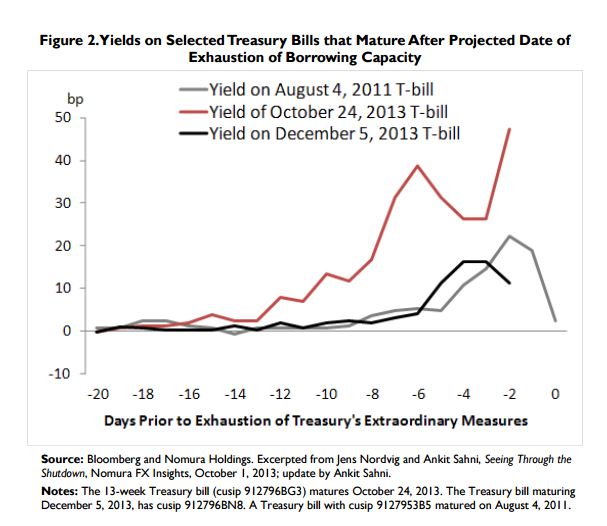
What to spend or tax is economics, the debt ceiling is politics. There will be a lot of political grandstanding and noise.  But everyone knows that defaulting rather than raising the debt ceiling would be disastrous. The debt ceiling will be raised in the end and then everyone will claim to have saved the day at the last moment. However, in the run-up to “victory” we could see yields on treasury securities scheduled to mature between now and November 15th jump higher or crash.  The chart below, from a recent report by the Congressional Research Services (see www.crs.gov #R43389) shows T-bill yields during some previous debt ceiling debates.

The FOMC, the Fed’s policy unit, meets next week on Tuesday and Wednesday. There is little chance that they will raise interest rates at the meeting. First, raising interest rates just as the debt ceiling is roiling the market isn’t a good idea. Second, there isn’t much new economic data since the last meeting on September 16th-17th and there is no post-meeting press conference scheduled.  Despite these reasons, right now there is an unusual amount of debate and discussion about Fed policy.

The FOMC is data-driven, its decision on raising interest rates, whenever it happens, will depend on how the economy looks at that time. The question of what they might do in at the December 15th-16th meeting depends on the economic reports appearing between now and then.  Moreover, as the economic numbers change, so do people’s opinions of the future. There is a lot of uncertainty and noise in forecasts of the Fed’s next move.  Currently the noise level is increased because of apparent disagreements among members of the Fed Board of Governors. In the last few weeks, Stanley Fischer argued for raising rates sooner while Lael Brainard and Daniel Tarullo spoke in favor of waiting longer and everyone is trying to guess Janet Yellin position.

Will the Fed act in December? If we knew what the future data will reveal and how people would react, we might have an answer.  What is likely is that until then the markets will see extra uncertainty even though the debt ceiling will have been raised.

The posts on this blog are opinions, not advice. Please read our Disclaimers.

The Effects of Regulation on Prescription Drugs

Contributor Image
Glenn Doody

Vice President, Product Management, Technology Innovation and Specialty Products

S&P Dow Jones Indices

According to a story in Canada’s Globe and Mail, one drug maker is about to take on an entire country to protect its right to price drugs the way they see fit.  Alexion Pharmaceuticals, the maker of the drug Soliris, has announced a lawsuit against Canada’s Patented Medicine Prices Review Board after the board began hearings in June to pressure Connecticut-based manufacturer Alexion Pharmaceuticals to lower the drug’s “excessive” price.  The Globe and Mail reports that, “the drug—dubbed the world’s costliest treatment for two rare, life-threatening blood and genetic disorders—is reportedly priced at between USD 500,000 and USD 700,000 annually per patient.”

According to the article, only two countries in the Organization for Economic Cooperation and Development have open pricing on drugs, the U.S. and Chile.  Canada’s regulation of overpricing of patented drugs dates back to 1987, with the establishment of the Patented Medicines Prices Review Board, a regulatory oversight body that has been granted the right to review and control prices of drugs still under patent, and it is a negotiated feature of the North American Free Trade Agreement established in 1994.  Prior to the free trade agreement, drug companies had much less protection against patent infringement by generic drug manufacturers long before their U.S. patents expired.

How effective has this board been at controlling overall drug prices in Canada?  By comparing the unit cost of brand drugs sold in Canada since 2009 to those sold in the U.S. (as measured by the S&P Healthcare Claims National Index), we can determine that on average, brand name drug prices have escalated 132% in the U.S. versus 23% in Canada.  Even if we remove 2014, when specialty drugs accounted for an increase of almost 30%, the six-year increase is still 119% in the U.S. versus just 18% in Canada.  Exhibit 1 illustrates the difference in cost increases in unit costs for both countries.

Capture

When comparing these cost increases to the average change in generic drug costs over the same period, we can see that open and competitive markets have led to a cost escalation of 8% in the U.S. and a 19% decrease in average costs of in Canada.  Taking these results into account, it becomes apparent just how important this lawsuit is for Canada, however U.S. lawmakers may want to take notice as well.  With a well-documented example from our neighbors to the north, a regulated market may be one potential solution for cost control for brand name drugs in the U.S. market.

Capture

The posts on this blog are opinions, not advice. Please read our Disclaimers.

Home Prices Are Rising Faster Than You Think

Contributor Image
David Blitzer

Former Managing Director and Chairman of the Index Committee

S&P Dow Jones Indices

Prices of existing single family homes, as measured by the S&P/Case-Shiller National Home Price index, are rising is single digit terms.  However, the price changes that matter – the real or inflation adjusted changes – may be higher than many suspect. Backing out inflation, as shown in the chart, gives real increases averaging 6.3% annually in 2012-20015. The compares to real increases of 6.8% annually during 1998-2005, the peak years of the housing boom. With two percent wage increases and one percent inflation, a real increase of 6% or more can make a difference.  These numbers may offer one explanation for the recent popularity of apartments and renting.

The chart shows the rate of inflation (green bars), the real increase in the S&P/Case-Shiller National Home Price Index (red bars) and the nominal increase in the index (blue line). The data for 1976 through 2014 are the 12 months ended in December; for 2015 data for December 2014 to July 2015 are used and annualized.


The Next S&P/Case-Shiller Home Price Release is Tuesday, October 27th


The posts on this blog are opinions, not advice. Please read our Disclaimers.

A Closer Look at SPIVA® India Mid-Year 2015

Contributor Image
Utkarsh Agrawal

Associate Director, Global Research & Design

S&P Dow Jones Indices

The SPIVA India Scorecard reports on the performance of actively managed Indian mutual funds compared with their respective benchmark indices over one-, three-, and five-year investment horizons.  With the SPIVA India Mid-Year 2015 Scorecard, we have also introduced asset-weighted fund returns and the quartile breakpoints of fund performance.

The latest scorecard has revealed that the majority of Indian equity large-cap funds outperformed the S&P BSE 100 over the past one-year period ending June 30, 2015.  In contrast, over the three- and five-year periods, they lagged the benchmark.  The excess returns of this peer group also diminished as the observation period was expanded (see Exhibit 1).

SPIVA EX1. 2015

From the quartile breakpoints of the fund performance, it was observed that there was a wide dispersion over the one-year period, which declined as the observation period was expanded (see Exhibit 2).

SPIVA EX2. 2015

For details on other categories, please read the full report.

For SPIVA® India Mid-Year 2015 Info-graphic, please click here.

The posts on this blog are opinions, not advice. Please read our Disclaimers.

Energy Stocks and Bonds Say Oil May Have Bottomed

Contributor Image
Jodie Gunzberg

Former Managing Director, Head of U.S. Equities

S&P Dow Jones Indices

Last week, the S&P GSCI Crude Oil gained 9.7% in one of its best weeks (24/1501) in history since 1987. It was the second best week in 2015, following its gain of 11.8% in the last week of Aug. Historically, with the exception of the bottom in 1988, there have been greater than 2 weeks of spikes bigger than last week’s before a bottom was hit. So maybe oil hasn’t hit a bottom yet by this metric, but it wouldn’t be completely unprecedented or unreasonable.

Source: S&P Dow Jones Indice
Source: S&P Dow Jones Indices

Although many supporting events happened simultaneously last week like a continued drop in US rig counts, concern about falling production in Canada and Bakken, the decision by the Fed to hold off on the interest rate hike and the Russian attacks on Syria, it’s difficult to make the case the rally is sustainable. Inventories are still very high and demand is questionable. According to the IEA’s Oil Market Report, “a projected marked slowdown in demand growth next year and the anticipated arrival of additional Iranian barrels – should international sanctions be eased – are likely to keep the market oversupplied through 2016.”

Sourec: International Energy Agency - Oil Market Report, Oct. 2015.
Source: International Energy Agency – Oil Market Report, Oct. 2015.

Last, one indicator that has historically crashed at the peak of volatility and oil bottom is open interest. It fell briefly but quickly elevated to its relatively high current level.

Source: S&P Dow Jones Indices and Bloomberg

Despite this, there are calls on oil that call a bottom in this quarter or next, and quote a range of $75 by the end of 2017.  PIRA energy group says the current market slump is setting the stage for prices to surge to $75 within two years, and below is a chart from Morgan Stanley of their oil market outlook, also showing oil in the $75 range for 2017.

Source: http://www.businessinsider.com/morgan-stanley-evolution-of-the-oil-cycle-through-2018-2015-9

So, what is the right call? S&P Dow Jones Indices isn’t in the business of making prediction but the indices are historical storytellers. A new family of indices, the S&P 500 Bond indices, has recently been introduced to help analyze companies and industries inside the S&P 500. Some of the sectors have significantly more equity, like technology, but some have more debt like utilities. Energy is pretty evenly matched, holding similar weights in each the stock and bond composite.

Let’s take a look at the performance relationships between the stocks and the bonds by using the S&P 500 Energy Total Return and the S&P 500 Energy Corporate Bond Index Total Return to see how the market views the equity risk premium, or in other words how strongly the market believes oil stocks will rise (equity performance) or fall (bond performance.) Historically the beta of the S&P GSCI Energy Excess Return (total return – T-bill) to energy stock alpha (S&P 500 Energy – S&P 500) is 1.05 and to energy bond alpha (S&P 500 Energy Corporate Bond Index – T-bill) s is 0.71, with respective correlations of 0.52 and 0.13.

Below is a chart of the historical S&P GSCI Energy TR index levels versus the equity risk premium as measured by the S&P 500 Energy Total Return monthly minus the S&P 500 Energy Corporate Bond Index Total Return monthly. Notice the recent spike in the equity risk premium that has developed in Oct. The magnitude of the equity risk premium and spread change from a discount to a premium is the biggest since Oct. 2011, and the magnitude is the 8th largest on record with the 5th biggest swing.

Source: S&P Dow Jones Indices

Maybe oil is near a bottom, or maybe just that’s the market sentiment. To find out what the experts think visit the replay of the S&P Dow Jones Indices 9th Annual Commodities Seminar. To find out more about the S&P Dow Jones Bond Indices, click here, or click on one of these links if you’d rather watch a short video about the basics of the bond index, or about what is inside the broad bond index or about the bond sectors. Please let us know if you have any questions.


The posts on this blog are opinions, not advice. Please read our Disclaimers.