Dividend yield is an important source of total return from an investment in equities. The other source is capital gains. While capital gains tend to be volatile and depend on the stock price movement in the market, dividend income tends to remain stable and depends on the dividend distribution policy of the company. The dividend policy may depend on the stage of the business life cycle, industry, economy in which the company operates, etc.
How India fares globally in terms of dividend yield?
India is an emerging economy and the growth opportunities are tremendous. The corporate debt market is minuscule in comparison to the government debt. Hence the companies are better off when they retain greater part of their earnings, and utilize it in the net positive value investments which generate returns in excess of the opportunity cost of capital. This is evident from the fact that India has historically been a low dividend yielding country. The difference between the yield of the S&P India BMI and S&P Developed BMI was almost 88bps as on April 30 2015. (See Exhibit 1)
Exhibit 1: Historical Dividend Yield
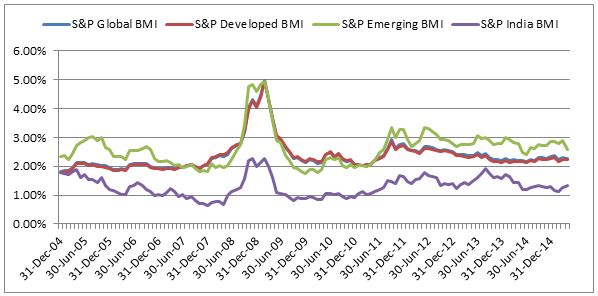
Source: S&P Dow Jones Indices
Comparison of the dividend yield between large mid cap and small cap companies
Indian large mid cap companies have exhibited more stable dividend yield in comparison to the small cap companies historically. At the time of global recession in 2007-08, the small cap companies had a higher drawdown in comparison to the large mid cap companies which led to higher dividend yield of the small cap companies in that period. The difference between the dividend yield of the S&P India SmallCap and the S&P India LargeMidCap peaked at 95 bps on February 28, 2009. (See Exhibit 2) Since the Indian Lok Sabha elections in May 2014, the S&P India LargeMidCap has delivered higher dividend yield than the S&P India SmallCap. (See Exhibit 2)
Exhibit 2: Historical Dividend Yield
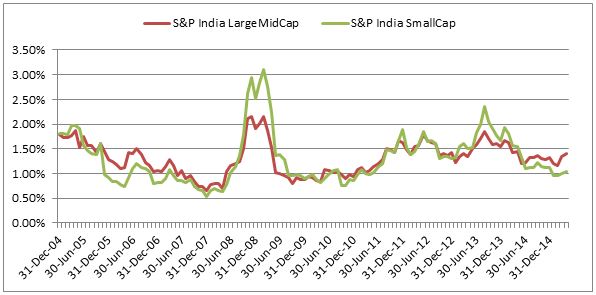
Source: S&P Dow Jones Indices
Difference between the dividend yield of Indian value and growth companies
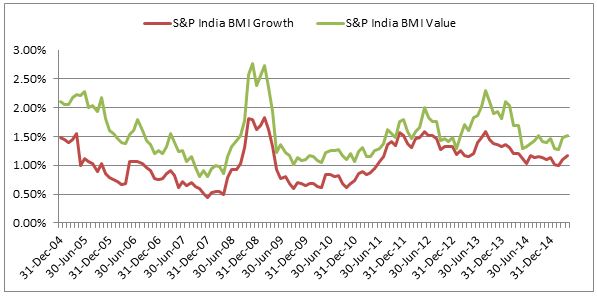
The growth companies tend to utilize higher percentage of their earnings and hence distribute lesser dividends to the shareholders in comparison to the value companies. Therefore the value companies should have higher dividend yields in comparison to the growth companies. The S&P India BMI Value has had higher dividend yield in comparison to the S&P India BMI Growth historically and the difference between the dividend yields of the indices was almost 34 bps as on April 30, 2015. (See Exhibit 3)
Exhibit 3: Historical Dividend Yield
Source: S&P Dow Jones Indices
The dividend yield of cyclical and defensive sectors
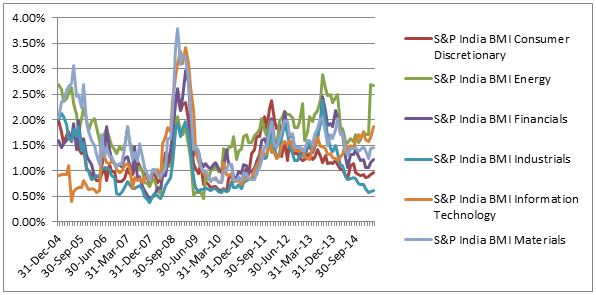
The sectors such as the consumer discretionary, energy, financials, industrials, information technology and materials are considered cyclical sectors. Amongst all these sectors, S&P India BMI Industrials had the lowest and S&P India BMI Energy had the highest dividend yield as on April 30, 2015. (See Exhibit 5)
Exhibit 4: Historical Dividend Yield
Source: S&P Dow Jones Indices
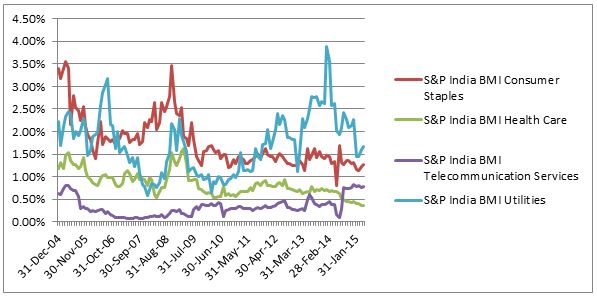
The sectors such as consumer staples, healthcare, telecommunication services and utilities are considered defensive sectors. Amongst these sectors, the dividend yield of the S&P India BMI Health Care and the S&P India BMI Telecommunication Services have remained the lowest historically. (See Exhibit 4)
Exhibit 5: Historical Dividend Yield
Source: S&P Dow Jones Indices
The dividend strategy in investments
Many investors consider dividend as important factor in the investment decisions. The models which utilize the dividends to value the companies are best suited for the investors who are minority shareholders and do not possess the power to alter the dividend policy of the company and the company has a stable and sustainable dividend payout ratio. S&P Dow Jones Indices has a vast family of indices focused on dividends like the dividend aristocrats, dividend opportunities, etc. Globally many ETF’s exist which are focused on dividend strategies. Since December 2014, Indian market also has introduced ETF’s focused on dividends.
The posts on this blog are opinions, not advice. Please read our Disclaimers.