Get Indexology® Blog updates via email.

In This List

Catalysts for ETF Market Growth in Hong Kong and China

The Tale of Dividend in India

Daraprim Price Increase–The Effect on Generic Drug Costs

Canada: Bonds Recover as Central Bank Leaves Rates Unchanged

Speculating About the Fed’s Timing

Catalysts for ETF Market Growth in Hong Kong and China

Contributor Image
Ellen Law

Former Associate Director, Asia Pacific Market Development

S&P Dow Jones Indices

The Asia-Pacific region is the third-largest ETF market in the world, after the U.S. and Europe. Despite the fact that the ETFs listed in the Asia-Pacific region represent less than 10% of global ETF assets, the region’s asset growth rate has outpaced the two former leaders and is now ranked at the top.

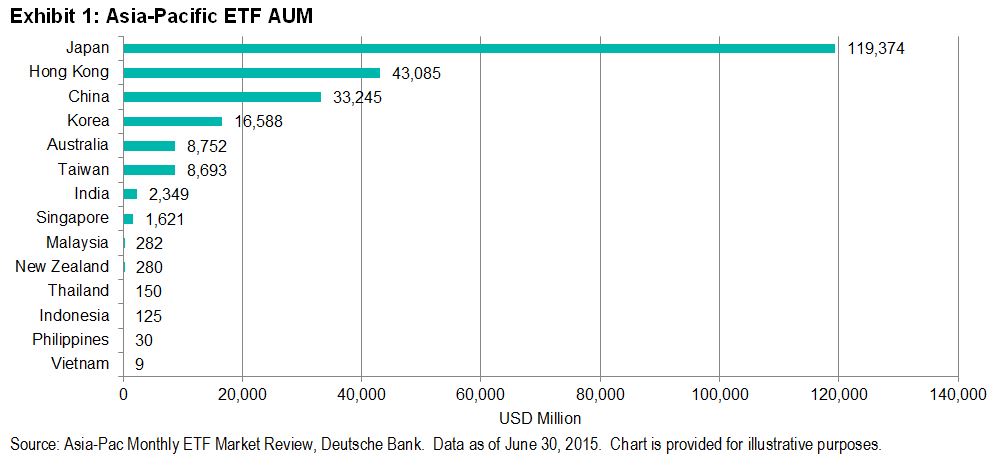
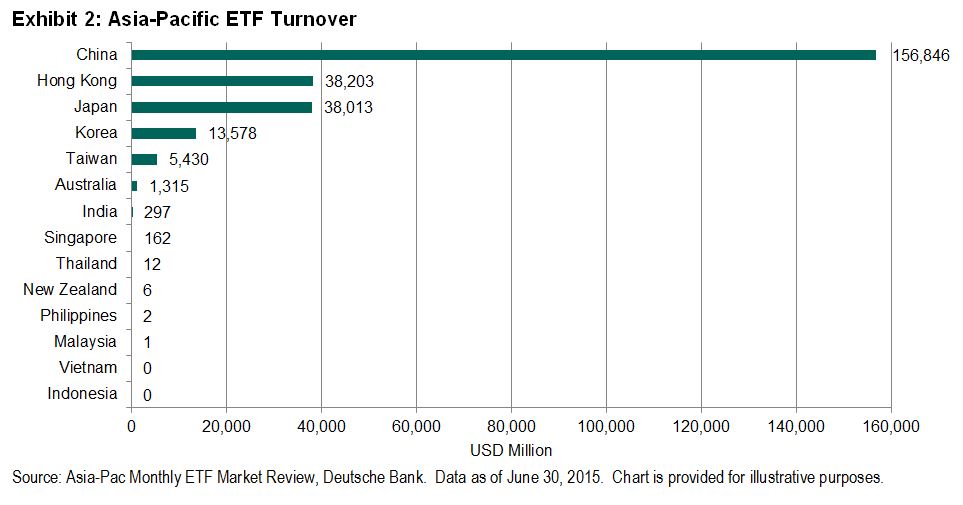
The Asia-Pacific ETF market is quite scattered, with ETFs listed across different countries.  By AUM, Japan has a dominant position in the Asia-Pacific ETF market (see Exhibit 1).  However, the significant growth potential of Hong Kong and China cannot be underestimated.  The exchanges in Hong Kong and China have recorded the highest ETF turnovers among their peers, at USD 38 billion and USD 157 billion, respectively (see Exhibit 2).  The emergence of cross-border initiatives, including Mainland-Hong Kong Mutual Recognition of Funds (Mutual Recognition) and Shenzhen-Hong Kong Stock Connect (SZ-HK Connect), could also serve as a catalyst for the growth of Hong Kong’s and China’s ETF markets.

Capture

Capture

Expanding Footprints to Other Markets
The Mutual Recognition and SZ-HK Connect programs are setting the stage for Hong Kong- and China-listed ETFs to penetrate the other markets.  The Mutual Recognition program allows eligible and approved mainland China and Hong Kong funds and ETFs to be offered to each other’s markets.  Similarly, the SZ-HK Connect program would allow eligible shares listed on the Shenzhen Stock Exchange and the Hong Kong Stock Exchange to be offered to the other markets (and could potentially include ETFs).  These two arrangements could open more opportunities for cross-border ETF distribution to retail investors and potentially help boost their sales momentum.

Stimulating ETF Market Growth
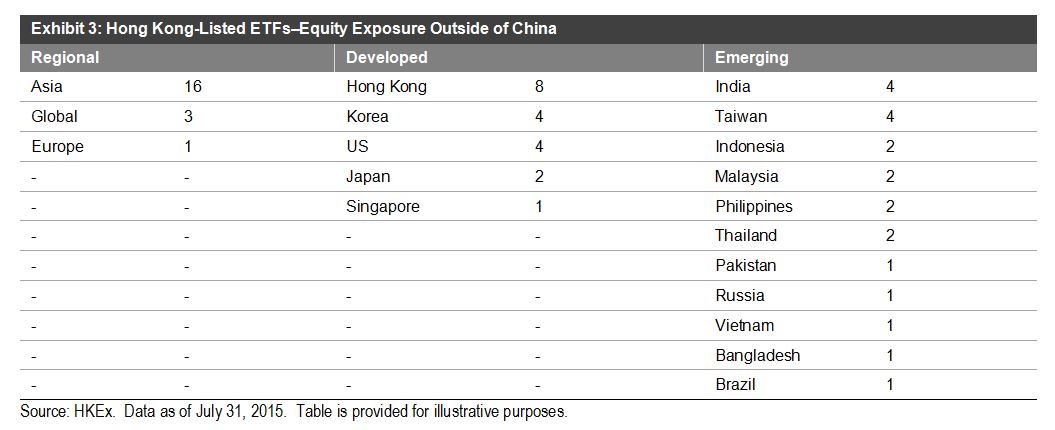
The Hong Kong ETF market is more diverse than the Chinese ETF market in terms of product offerings, and hence the southbound flow could benefit more from the cross-border initiatives.  On top of the strong product lineup of local Hong Kong and A-shares ETFs, Hong Kong has also showcased a variety of ETFs covering different geographies, sectors, and asset classes.

The China A-shares market has become volatile this year, which is a concern for many investors in mainland China.  To diversify their risk out of the A-share market, investors may look for investment products that provide overseas exposure.  Hong Kong-listed ETFs could be a good tool for them to access markets outside of China.

Capture

Furthermore, the cross-border initiatives could accelerate the development of China’s ETF market.  China-listed ETFs will be facing direct competition from their Hong Kong counterparts that are well-regulated and more advanced in terms of market making, product diversification, investor education, etc.  In order to become more competitive and keep abreast of the global standard, China’s ETF market could be enhanced in order to attract more inflow over the long term.

The posts on this blog are opinions, not advice. Please read our Disclaimers.

The Tale of Dividend in India

Contributor Image
Utkarsh Agrawal

Associate Director, Global Research & Design

S&P Dow Jones Indices

Dividend yield is an important source of total return from an investment in equities. The other source is capital gains. While capital gains tend to be volatile and depend on the stock price movement in the market, dividend income tends to remain stable and depends on the dividend distribution policy of the company. The dividend policy may depend on the stage of the business life cycle, industry, economy in which the company operates, etc.

How India fares globally in terms of dividend yield?

India is an emerging economy and the growth opportunities are tremendous. The corporate debt market is minuscule in comparison to the government debt. Hence the companies are better off when they retain greater part of their earnings, and utilize it in the net positive value investments which generate returns in excess of the opportunity cost of capital. This is evident from the fact that India has historically been a low dividend yielding country. The difference between the yield of the S&P India BMI and S&P Developed BMI was almost 88bps as on April 30 2015. (See Exhibit 1)

Exhibit 1: Historical Dividend Yield

exhibit 1

Source: S&P Dow Jones Indices

Comparison of the dividend yield between large mid cap and small cap companies

Indian large mid cap companies have exhibited more stable dividend yield in comparison to the small cap companies historically. At the time of global recession in 2007-08, the small cap companies had a higher drawdown in comparison to the large mid cap companies which led to higher dividend yield of the small cap companies in that period. The difference between the dividend yield of the S&P India SmallCap and the S&P India LargeMidCap peaked at 95 bps on February 28, 2009. (See Exhibit 2) Since the Indian Lok Sabha elections in May 2014, the S&P India LargeMidCap has delivered higher dividend yield than the S&P India SmallCap. (See Exhibit 2)

Exhibit 2: Historical Dividend Yield

exhibit 2

Source: S&P Dow Jones Indices

Difference between the dividend yield of Indian value and growth companies

The growth companies tend to utilize higher percentage of their earnings and hence distribute lesser dividends to the shareholders in comparison to the value companies. Therefore the value companies should have higher dividend yields in comparison to the growth companies. The S&P India BMI Value has had higher dividend yield in comparison to the S&P India BMI Growth historically and the difference between the dividend yields of the indices was almost 34 bps as on April 30, 2015. (See Exhibit 3)

Exhibit 3: Historical Dividend Yield

exhibit 3

Source: S&P Dow Jones Indices

The dividend yield of cyclical and defensive sectors

The sectors such as the consumer discretionary, energy, financials, industrials, information technology and materials are considered cyclical sectors. Amongst all these sectors, S&P India BMI Industrials had the lowest and S&P India BMI Energy had the highest dividend yield as on April 30, 2015. (See Exhibit 5)

Exhibit 4: Historical Dividend Yield

exhibit 4

Source: S&P Dow Jones Indices

The sectors such as consumer staples, healthcare, telecommunication services and utilities are considered defensive sectors. Amongst these sectors, the dividend yield of the S&P India BMI Health Care and the S&P India BMI Telecommunication Services have remained the lowest historically. (See Exhibit 4)

Exhibit 5: Historical Dividend Yield

exhibit 5

Source: S&P Dow Jones Indices

The dividend strategy in investments

Many investors consider dividend as important factor in the investment decisions. The models which utilize the dividends to value the companies are best suited for the investors who are minority shareholders and do not possess the power to alter the dividend policy of the company and the company has a stable and sustainable dividend payout ratio. S&P Dow Jones Indices has a vast family of indices focused on dividends like the dividend aristocrats, dividend opportunities, etc. Globally many ETF’s exist which are focused on dividend strategies. Since December 2014, Indian market also has introduced ETF’s focused on dividends.

The posts on this blog are opinions, not advice. Please read our Disclaimers.

Daraprim Price Increase–The Effect on Generic Drug Costs

Contributor Image
Glenn Doody

Vice President, Product Management, Technology Innovation and Specialty Products

S&P Dow Jones Indices

The week of Sept. 21, 2015, saw a flurry of stories about the escalating cost of drugs in the U.S. marketplace. These stories were all initiated by Turing Pharmaceuticals buyout of the drug Daraprim (NY Times Story) and the decision to increase the price per tablet from USD 13.50 to USD 750.00. Turing’s stated reason for the price increase was the fact that the drug is only distributed to about 2,000 users nationally, and therefore at USD 13.50 the drug was not profitable. However, Daraprim is a generic drug that has been on the market for over 70 years, and therefore it is open to competition. In all likelihood, had the price increase held, Turing would have opened itself up to new competition, which would have forced the price back to a more competitive level. In reality, because Turing is currently the only manufacturer, this situation is similar to when a brand drug is coming off patent, and is still able to attract a premium price, before other competitors have time to introduce competing generics and normalize the market.

Capture

As can be demonstrated by the S&P Healthcare Claims Indices, there are volatile escalations in the overall cost of generic drugs from time to time. These swings are often the result of drugs coming off patent and the resulting market opening for competition. Under the U.S. patent law, drugs coming off patent are open to competition by a single generic producer for a period of six months, and that producer would obviously have a huge price advantage over the market for that period of time. After the initial six month period, the market is open to all generic drug producers to compete. During this phase, we would expect to see costs decrease, as fair market competition brings prices to a market competitive level.

Compared with the overall cost of brand-name drugs, the unit cost of generics is still increasing at a much slower pace. We have seen a significant increase in brand-name drugs recently due to the escalating costs of specialty drugs, such as Sovaldi. With all of that said, in the case of Turing’s drug, a target market of only 2,000 users may not attract huge interest by other manufactures to create a product to compete with, therefore it is possible that a generic drug such as Daraprim could sustain a significantly higher unit cost price than a product with a much wider distribution network. This scenario is based on the facts of competitive markets, and it does not take into account the public reaction that drug manufacturers must also deal with on a daily basis. Anytime a drug manufacturer increases the price of a drug that has a critical role in combating a serious disease by over 5,000%, there is likely to be a public pushback, followed by a political reaction, which may be more severe than the drug manufacturer anticipated.

The posts on this blog are opinions, not advice. Please read our Disclaimers.

Canada: Bonds Recover as Central Bank Leaves Rates Unchanged

Contributor Image
Kevin Horan

Former Director, Fixed Income Indices

S&P Dow Jones Indices

The Bank of Canada left its key interest rate unchanged at 0.5% last Wednesday, Sept. 9, 2015.  The message from the central bank was that it could be “considerable time” before there is significant recovery from the collapse of oil prices that pushed the economy into a technical recession.  The last rate cut was back on July 15, 2015, and the central bank feels the effects of that action are still working their way into the economy.  The number of jobs is also an important factor to watch.  The Canadian economy added 12,000 jobs in August and exports were up for the second month in a row, but the unemployment rate also rose to its current level of 7%.

So far, September has been positive for Canadian indices, as Exhibit 1 indicates.  Bonds rated CCC and lower have returned 0.17% for the month, while they have lost 14.19% YTD, as of Sept. 15, 2015.  The S&P Canada CCC & Lower High Yield Corporate Bond Index was as low as -18.36% YTD as of Aug. 20, 2015, before recovering to the level seen as of Sept. 14, 2015.  The S&P Canada B High Yield Corporate Bond Index, which measures single B bonds, had a total return as high as 5.84% YTD at the beginning of July, but as of Sept. 14, 2015, it has returned 3.29% YTD after bouncing back from a 1.71% YTD return on Aug. 25, 2015.

Exhibit 1: Canadian Indices Returns
Returns of Canadian Indices


Source: S&P Dow Jones Indices LLC.  Data from Sept. 14, 2015.  Past performance is no guarantee of future results.  Table is provided for illustrative purposes.

The posts on this blog are opinions, not advice. Please read our Disclaimers.

Speculating About the Fed’s Timing

Contributor Image
David Blitzer

Former Managing Director and Chairman of the Index Committee

S&P Dow Jones Indices

Little new data, lots of chatter from Wall Street and no clear signals about what the Fed might do at next week’s FOMC meeting. The announcement, either no change or a rate increase, is expected on Thursday afternoon September 17th around 2 PM Washington DC time.

Those looking for some hint of what this might mean for the stock market can lean on a bit of history reported in the Economist this week.  Since 1955 there have been 12 Fed tightening cycles, averaging two years each with an average increase of five percentage points. Typically recessions appears after three years, but not always. Given the changes in the economy, business cycles and inflation, 12 cycles are not enough observations to identify a pattern.  One favorable piece of history is that in nine of the 12 cycles equity prices rose in the year after the start of a tightening cycle. One reason may be that the Fed tends to move when the economy is strong, earnings are climbing and it fears over-heating.  Today earnings per share on the S&P 500 are roughly flat: the change from June 2014 to June 2015, based on available data, was -3.2%.

For those who prefer pictures to numbers, the chart shows the S&P 500 and the Fed Funds rate monthly since 1954 with recessions marked by the vertical lines. More often than not, rising rates lead to falling stock prices.

The story for bonds is simpler. From the early 1950s to 1982 bond yields rose and bond prices fell.  Yields peaked in mid-teens for treasuries. Since the August 1982 peak yields have come down to their present rock-bottom level. While bond yields may not rise in lock-step with the Fed funds rate, we are at the zero lower bound and the next move will be up. The chart below shows the modern history of US treasury bonds and the Fed funds rate.

Those who prefer trading signals to economic history can look to the CME Group’s FedWatch which offers a probability distribution for the funds rate based on the Fed Funds futures market. As of Friday afternoon, the odds for the funds rate on September 17th were 77% for 25 bp and 23% for 50 bp.  Looking ahead to the December FOMC meeting, the odds for 25 bp are 41%, 43% for 50 bp and 16% for 75 or 100 bp.

Taking everything together, a rate hike is coming but no one knows when.

The posts on this blog are opinions, not advice. Please read our Disclaimers.