Get Indexology® Blog updates via email.

In This List

Big Picture: Bonds Have Held Up Well

Commodities Post 4th Biggest 2-Day Gain Since 1970

Asian Fixed Income: Chinese Bonds Rose After China Rate Cut

Implementing Carbon-free Investment Mandates using Index Futures

Equity Markets May Be “Sassy”, But Bond Markets Are The “Cool” Kids On The Block…

Big Picture: Bonds Have Held Up Well

Contributor Image
Kevin Horan

Former Director, Fixed Income Indices

S&P Dow Jones Indices

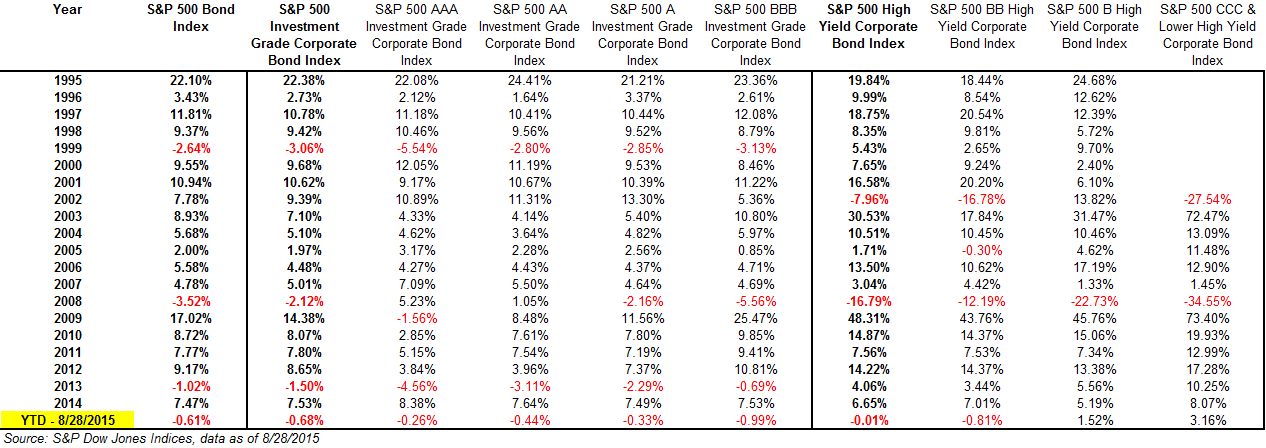
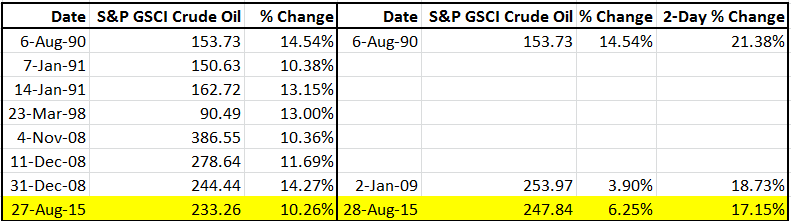
August is shaping up to be a negative month for the S&P 500 Bond Index (-0.52% month-to-date and -0.61% YTD), as of Aug. 28, 2015.  Though, for all the drama of this month, attributable to the drop in oil prices (-24% YTD), weakness in the Chinese economy, and a major sell-off in equities, bond returns look relatively stable.  U.S. equities, as measured by the S&P 500, have a total return of -2.07% YTD, (-3.4% price return) as of the same date.

Investors who have been chasing higher yields by moving down in credit will most likely experience a loss this month, as the S&P 500 High Yield Corporate Bond Index has returned -1.26% month-to-date.  The S&P 500 BB High Yield Corporate Bond Index has returned -1.5% month-to-date, while the single B index is down -0.70% month-to-date and the CCC and lower index is down -0.99% month-to-date.  When looking at the year-to-date returns, the riskiest of assets (S&P 500 CCC & Lower High Yield Corporate Bond Index) is still holding up, returning 3.16% after being as high as 4.33% on July 16, 2015.

Higher up the rating scale, the loss has been to a lesser degree.  The S&P 500 Investment Grade Corporate Bond Index has returned -0.46% month-to-date and -0.68% YTD.  The monthly returns by rating bucket are as would be expected, with AAA returning -0.18%, AA -0.26%, A -0.25%, and BBB -0.65% month-to-date.

At the height of this month’s selling, many questions arose about how bonds have performed historically.  Exhibit 1 shows that even in most stressed of times (2008), investment-grade bonds weathered the storm, while high-yield bonds experienced significant losses.  Those losses did not last too long, however, as the lower credits and investment-grade bonds bounced back in performance in December 2008 and did not look back during 2009.

Exhibit 1: Historical Returns
S&P 500 Bond Index and Rating Sub-Indices

The posts on this blog are opinions, not advice. Please read our Disclaimers.

Commodities Post 4th Biggest 2-Day Gain Since 1970

Contributor Image
Jodie Gunzberg

Former Managing Director, Head of U.S. Equities

S&P Dow Jones Indices

As of the close on Aug. 28, 2015, the S&P GSCI Total Return gained 8.98%, the most in 2 days since Jan. 2, 2009.  It was the 4th best gain over 2 consecutive days in the history of the index that has data beginning on Jan. 2, 1970. The bigger 2-day gains are shown in the table below:

Source: S&P Dow Jones Indices LLC. Daily Data from Jan. 2, 1970 - Aug. 28, 2015.
Source: S&P Dow Jones Indices LLC. Daily Data from Jan. 2, 1970 – Aug. 28, 2015.

The high total returns in the world production weighted S&P GSCI were driven by strong oil performance, the biggest component in the index. On Aug. 27, 2015, the S&P GSCI Crude Oil experienced its 8th biggest gain in history, up 10.26%. This was followed by another daily gain of 6.25% to record the 3rd biggest 2-day gain for the S&P GSCI Crude Oil, in its history since Jan. 6, 1987 as shown below:

Source: S&P Dow Jones Indices LLC. Daily Data from Jan. 6, 1987 - Aug. 28, 2015.
Source: S&P Dow Jones Indices LLC. Daily Data from Jan. 6, 1987 – Aug. 28, 2015.

As shown before, rising oil floats all boats, and on Friday 17 of the 24 commodities gained, which is a major improvement from the direction last month when 23/24 commodities recorded negative total returns. However, when looking month-to-date in August, it is not much better with only 3 positive commodities; lead +1.8%, lean hogs +4.2% and gold +3.6%.

Unfortunately for commodities, just because there was a historically large spike, it doesn’t indicate they hit the bottom.

After the 2-day gain of 10.4% on Aug 6, 1990, the S&P GSCI continued to gain 25.7% through Oct. 9, 1990, but lost it all giving up 26.8% by Jan. 18, 1991. It never really picked up again until 1996.

Source: S&P Dow Jones Indices

The two other higher 2-day gains were realized in the 2008-9 time period. The first spike on Jun. 6, 2008 happened before the crash but the second spike happened on the way down. The latter is more interesting to evaluate since the peak only squeezed out an extra 5.3% by July 3, in 2008. However, the 2-day spike ending Jan. 2, 2009, was followed by a decline of 24.2% until the bottom seemed to reached on Feb. 18, 2009.

Source: S&P Dow Jones Indices

While the index rose 85.3% until Apr. 8, 2011, it has now given up 53.8% and has created a new biggest drawdown of 77.5% as of Aug. 26, 2015. It is yet to be seen whether the fall will continue but what is concerning besides the difficult fundamentals is that the volatility is still not historically high. Historically the volatility has spiked, becoming too volatile for investors hence causing them to sell. This has driven  drops in open interest in historical crises that we haven’t seen yet.

Source: S&P Dow Jones Indices. Red line is 90-Day Annualized Rolling Volatility on left axis. Blue line is Index Levels on the right axis.


To hear more expert opinions about commodities, please join us for our 9th annual commodity seminar. 

Source: S&P Dow Jones Indices LLC. Daily Data from Jan. 2, 1970 – Aug. 28, 2015. The launch date of the S&P GSCI was May 1, 1991. All information presented prior to the index launch date is back-tested. Back-tested performance is not actual performance, but is hypothetical. The back-test calculations are based on the same methodology that was in effect when the index was officially launched. Past performance is not a guarantee of future results. Please see the Performance Disclosure at http://www.spindices.com/regulatory-affairs-disclaimers/ for more information regarding the inherent limitations associated with back-tested performance.


The posts on this blog are opinions, not advice. Please read our Disclaimers.

Asian Fixed Income: Chinese Bonds Rose After China Rate Cut

Contributor Image
Michele Leung

Former Director, Fixed Income Indices

S&P Dow Jones Indices

China announced another policy rate and RRR cut this week. The one-year deposit and lending rates were lowered by 25bps to 1.75% and 4.65%, while RRR is reduced by 50bps to 18%. These measures aim to offset increased capital outflow and stabilize the economy.

While investors should remain cautious with market volatilities, certain Chinese assets with strong fundamentals and attractive carry could be appealing. China is expected to grow in importance for global markets. As of August 27, the S&P China Bond Index has delivered a total return of 0.49% MTD and 4.46% YTD, while its yield-to-maturity stands at 3.59%.

Looking specifically at the corporate sector, the S&P China Corporate Bond Index delivered total return of 5.29% YTD as of the same date, consistently outperforming the S&P 500®Bond Index over the last two years, see exhibit 1. The S&P 500®Bond Index is designed to be a corporate-bond counterpart to the S&P 500, which is widely regarded as the best single gauge of large-cap U.S. equities.  In addition, the historical monthly returns of the S&P China Corporate Bond Index and S&P 500®Bond Index demonstrated a low correlation (0.2075) between the two markets, meaning Chinese corporate bonds could provide a good source of diversification to global investors, see exhibit 2.

The S&P China High Quality Corporate Bond 3-7 Year Index, an investible index tracks the performance of Chinese corporate bonds within three to seven year tenors and uses more stringent rating criteria, has outperformed its boarder benchmark and returned 5.70% YTD, as of August 27, 2015. The S&P China High Quality Corporate Bond 3-7 Year Index (USD) gained 2.31% in the same period, reflecting the currency performance.

The yield-to-maturity of the S&P China High Quality Corporate Bond 3-7 Year Index is 4.13%, compared with the yield-to-maturity of the S&P 500 Investment Grade Corporate Bond Index at 3.17%.

Exhibit 1: Total Returns of the indices

S&P 500 Bond Index S&P 500 Investment Grade Corporate Bond Index S&P China Corporate Bond Index S&P China High Quality Corporate Bond 3-7 Year Index
YTD -0.59% -0.64% 5.29% 5.70%
1-Year 1.40% 1.38% 9.56% 10.09%
2-Year 7.98% 7.83% 13.99% 14.00%

Source: S&P Dow Jones Indices.  Data as of August 27, 2015.  Table is provided for illustrative purposes.  Past performance is no guarantee of future results.

Exhibit 2: Correlation of the indices

S&P 500 Bond Index S&P 500 Investment Grade Corporate Bond Index S&P China Corporate Bond Index S&P China High Quality Corporate Bond 3-7 Year Index
S&P 500 Bond Index 1 0.9983 0.2075 0.1666
S&P 500 Investment Grade Corporate Bond Index 1 0.1860 0.1516
S&P China Corporate Bond Index 1 0.9491
S&P China High Quality Corporate Bond 3-7 Year Index 1

Source: S&P Dow Jones Indices.  Data as of August 27, 2015, based on the monthly returns from January 1, 2013.  Table is provided for illustrative purposes.  Past performance is no guarantee of future results.


The posts on this blog are opinions, not advice. Please read our Disclaimers.

Implementing Carbon-free Investment Mandates using Index Futures

Contributor Image
Richard Co

Executive Director, Equity Products

CME Group

Socially responsible investment mandates have gradually worked their way into the investment world. The most prominent example might be the divestiture of companies that are involved in the expansion of mankind’s carbon footprint, i.e. the Energy Sector. At the same time, there is often a need to use listed derivatives to achieve the investment outcome. Example might include the need to equitize cash in the portfolio or manage the inflow and outflow of cash effectively to avoid cash drag.  Luckily, this can be accomplished with index futures such as those listed for trading at CME Group.  For example, one can easily replicate the S&P 500 ex-Energy with just the E-mini S&P 500 futures and the E-mini S&P Energy Select Sector Futures.

Capture

On August 12, 2014, the energy sector represented approximately 7.3% of the S&P 500 index. Thus, for a $100 million-portfolio, approximately $7.3 million is tied up in the energy sector that is slated for divestiture under the social mandate. Simply selling short the equivalence of $7.3 million worth of E-mini S&P Energy Select Sector Index futures, or any other derivatives replicating that sector, is not the answer. If that was the only action taken, the resulting investment portfolio would be under invested… indeed by the same $7.3 million.

Thus additional investment needs to be made to bring it back to full deployment. If we denote the weight of the energy sector as W, the correct “hedge ratio” should be:

Capture

Summing the two quantities gives you the full portfolio value again. As we have mentioned, W’s value was 9% on November 20, 2014. For a portfolio value of $100 million, these two quantities are $107.9 million and -$7.9 million respectively. Therefore, to achieve the goal of removing energy sector exposure while remaining fully invested, one option is to buy an additional $7.9 million in S&P 500 and sell $7.9 million in Energy Sector exposure – a spread trade that can be done all with equity index futures!

And the performance, you ask? The result from futures replication is indistinguishable from the assembling of the S&P 500 ex-Energy portfolio. Of course, the replication of the performance may depend on factors impacting the index futures market and future investment result may depart from what is depicted here.

Capture

There are some nuances in using the E-mini S&P 500 Energy Select Sector futures as the surrogate. For those interested, the nuances are explained in CME Group’s publication available here.

The posts on this blog are opinions, not advice. Please read our Disclaimers.

Equity Markets May Be “Sassy”, But Bond Markets Are The “Cool” Kids On The Block…

Contributor Image
Heather Mcardle

Director, Fixed Income Indices

S&P Dow Jones Indices

Bond markets may not be the most “sassy” of all the asset classes, but they certainly are a lot “cooler” in light of the global equity sell-off of the last two days.   Bond markets are traditionally known to be less volatile than all of the financial asset classes.  Global stock markets are taking serious hits over concerns that China’s growth is significantly slowing, and the impact this has for the world economy.   Bonds on the other hand, have been relatively stable, and despite a Chinese Yuan devaluation earlier in the month, Chinese sovereign bonds haven’t moved much.

The China S&P China Sovereign Bond Index, an index to track the performance of local-currency denominated sovereign bonds from China, is currently yielding 3.19%, has had 1 year annual returns of 8.49%, and as of today, is trading at the exact same yield as of June 1, 2015.  (Chinese equity volatility began in early June).  Between June 1 and today, this index has yielded between 3.07% – 3.23%, a considerably tight range considering the uncertainty and volatility in the region.  In particular, on the two biggest equity sell-off days globally, this index reacted in a rather “cool” manner:  on Thursday, August 20th, the index yielded 3.21%, was unchanged on Friday, and then tightened to 3.19% as of Monday’s close.  That’s a 3bps change.  Even on the day of the Yuan devaluation, the index widened only 2bps in reaction.

What does this say about Chinese sovereign bond markets?  They have low correlation to the Chinese equity market.  They behave like most other AA rated bonds in terms of lower volatility and “flight to safety” behavior.  Chinese sovereign bonds also have relatively higher yields compared to other AA rated countries.

The S&P Germany Sovereign Bond Index, has reacted similarly over the last few days. The S&P Germany Sovereign Bond Index yielded .20% on Thursday August 20th, tightened only 1bp to .19% on Friday the 21st, and closed Monday at .21%.  Even the S&P Spain Sovereign Bond Index, an index with a higher risk profile than Germany, tightened 1bp from Thursday to Friday, to 1.20% and closed at 1.24% on Monday.  Despite risk profiles, the stability of these indices show the appeal of bond markets in times of global market turmoil.

Capture

The posts on this blog are opinions, not advice. Please read our Disclaimers.