Get Indexology® Blog updates via email.

In This List

A Tale of Two Benchmarks: Benchmark Selection

Sector Dispersion and Active Management

Introducing the S&P Dow Jones Indices Versus Active (SPIVA®) Latin America Scorecard

China Bond Defaults and Indexing the China Bond Market

When Did Everyone Get so Sick?

A Tale of Two Benchmarks: Benchmark Selection

Contributor Image
Phillip Brzenk

Managing Director, Global Head of Multi-Asset Indices

S&P Dow Jones Indices

This is the fourth post in a series of blog posts relating to the in-depth analysis of performance differential between the S&P SmallCap 600® and the Russell 2000.

The previous posts demonstrate that the different historical risk/return profiles of the two U.S. small-cap benchmarks can be partially explained by the July reconstitution effect and the additional S&P DJI screening criteria.  The difference in returns between the two indices highlights the fact that investors should be aware that index construction differences can have a meaningful impact on returns.  Both indices represent a particular market segment which, in turn, poses practical considerations for both passive and active investors who employ index returns as a key decision input in the investment process.

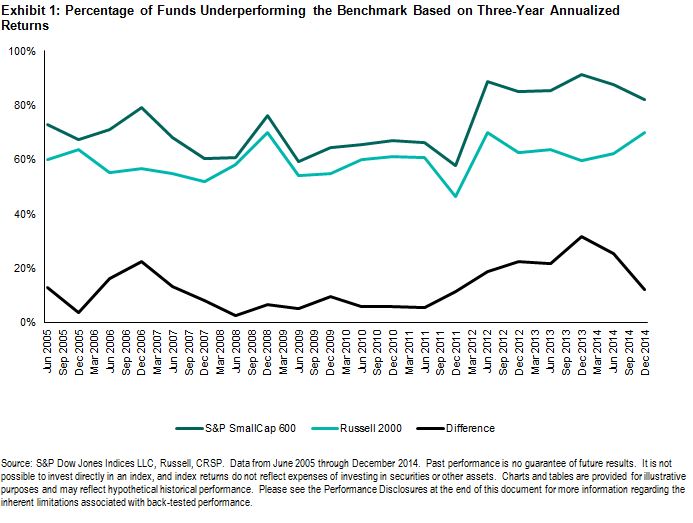
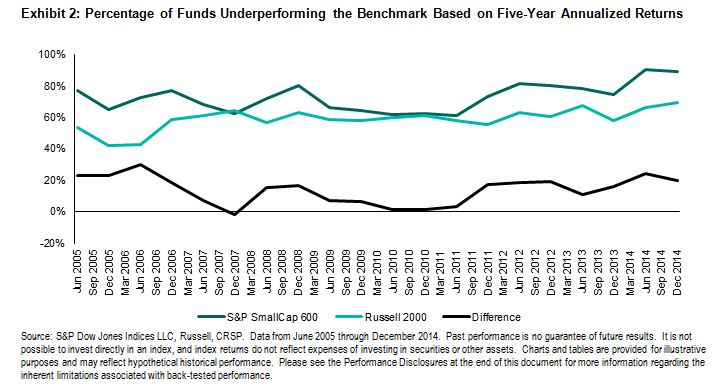
For those tasked with evaluating managers, conclusions about the ability of a manager to add value can vary depending on which benchmark is used in the evaluation.  In that light, we looked at the impact of benchmark selection in the performance measurement process.  In order to determine the effect that selecting one of the small-cap indices can have in evaluation, a universe of actively managed U.S. small-cap funds were compared against the indices.  Exhibits 1 and 2 show the percentage of funds that underperformed each benchmark based on rolling three- and five-year returns, respectively, on a semiannual basis from 2005 through 2014.  Based on the three-year annualized returns, approximately 73% of funds underperformed the S&P SmallCap 600 on average, while approximately 60% underperformed the Russell 2000 over the same period.  Results are similar looking at the five-year annualized returns, where approximately 73% underperformed the S&P SmallCap 600 and approximately 59% underperformed the Russell 2000.

Capture

Capture

These results highlight the difficulty investors sometimes face in measuring the value offered by active managers.  If different benchmarks measuring the same asset class can yield different realized returns, the ability to differentiate a skilled manager from an unskilled one can be an arduous process.  We now look at the information ratio (IR), defined as the active return divided by active risk, to measure the effectiveness of a manager’s investment insight, irrespective of the benchmark against which he or she is being measured.

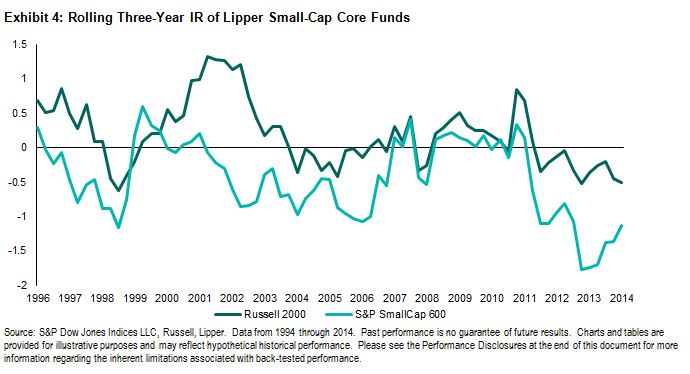
To do this, we calculate the IRs of the active small-cap funds against the two benchmarks.  With active funds in the Lipper Small-Cap Core Fund category as the universe, the average IR using rolling three-year annualized returns is computed on a quarterly basis from December 1996 through December 2014.  We see that there is a noticeable difference in the average IR of the category when the S&P SmallCap 600 is used as the benchmark compared with when the Russell 2000 is used.  The average of the three-year rolling IRs is negative for the universe compared to the S&P SmallCap 600 (IR = -0.24), while it is positive when compared to the Russell (IR = 0.25).

Capture

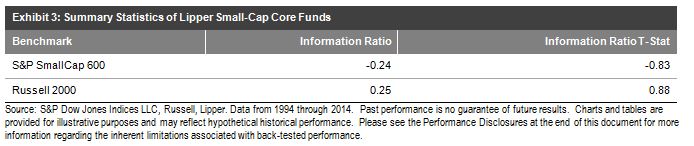
The rolling three-year information ratios show that the S&P SmallCap 600 is almost always the tougher benchmark to beat for active managers.  Investors may want to consider that the selection of a benchmark matters when it comes to benchmarking domestic small-cap equities.

Capture

The posts on this blog are opinions, not advice. Please read our Disclaimers.

Sector Dispersion and Active Management

Contributor Image
Craig Lazzara

Former Managing Director, Index Investment Strategy

S&P Dow Jones Indices

Market volatility is a function of both dispersion and correlation, as shown in this schematic:

Dispersion and correlation 2Dispersion measures the degree to which the components of an index perform similarly.  If the components are tightly bunched, dispersion will be low and, other things equal, the index’s volatility will be low.  Correlation is a measure of timing; it measures the tendency of index components to rise or fall at the same time.  If the components tend to move together, correlation will be relatively high, and volatility will rise.  If component moves tend to offset, correlation and volatility will be lower.  In terms of our simple schematic, the farther from the origin an index is, the higher its volatility will be.

Dispersion, correlation, and volatility can be measured at the market index level, of course, but can equally well be measured at a finer level of granularity.  Below we’ve graphed these metrics for each of the 10 sectors of the S&P 500:

S&P 500 sector dispersion and correlationWe immediately notice that the highest volatility sectors tend to be the farthest from the origin and the lowest volatility sectors the closest — confirming our intuition about the interaction of dispersion and correlation.  But these data — ironically, perhaps, derived entirely from passive benchmarks — can also provide some useful guidance for active investors.

First, since dispersion measures the potential benefit of stock selection, an active stock picker might wish to concentrate his efforts on high-dispersion sectors.  There is, e.g., more potential benefit to choosing among technology stocks than among energy companies or utilities.  If analytic resources are scarce, in fact, there’s an argument to be made for simply indexing the low-dispersion sectors.  (We know at least one major institutional investor which does exactly that.)

Second, the nature of the most relevant analytic input differs across sectors.  For low-dispersion, high-correlation sectors, the most important decision is the sector call, not individual stock recommendations.  The returns of the constituents of these sectors tend to cluster relatively tightly, so stock selection is of relatively little value.  On the other hand, where correlations are high, it means that most stocks in the sector move up and down together.  A correct sector call will be reflected more consistently across all sector components.

An analyst who follows utilities or energy would be well advised to spend most of his time and effort deciding whether to be in or out of the sector.  An analyst who follows technology or healthcare may be better off trying to separate the sectoral wheat from the sectoral chaff.  Dispersion and correlation not only provide insight into the volatility of sector returns, but offer guidance for active analysts as well.

The posts on this blog are opinions, not advice. Please read our Disclaimers.

Introducing the S&P Dow Jones Indices Versus Active (SPIVA®) Latin America Scorecard

Contributor Image
Phillip Brzenk

Managing Director, Global Head of Multi-Asset Indices

S&P Dow Jones Indices

S&P Dow Jones Indices is proud to expand the SPIVA Scorecard report to the Latin America region.  The SPIVA methodology is designed to provide an accurate and objective apples-to-apples comparison of active funds’ performance versus their appropriate style benchmark indices.  The SPIVA Latin America Scorecard covers the Brazilian, Chilean, and Mexican markets.  A summary of the year-end 2014 results in the three markets follows.

Brazil
Actively managed Brazilian funds underperformed their category’s benchmark in all five fund categories in 2014.  In the Brazil Equity category, 50.36%of managers underperformed the S&P Brazil BMI for the year.  Managers focusing on a particular size segment did not fare favorably, with 72.92% underperforming in the Brazil Large-Cap Equity category and 69.77% underperforming in the Brazil Mid/Small-Cap Equity category.  In the fixed income categories, active managers overwhelmingly underperformed their benchmarks: 83.52% of managers in the Brazil Corporate Bond category and 82.95% in the Brazil Government Bond category underperformed their respective benchmarks in 2014.  Similar underperformance for all five categories was seen over the three- and five-year periods.

Chile
A slight majority (53%) of active equity fund managers in Chile were able to outperform the benchmark in 2014.  The short-term success of the managers is in stark contrast to their long-term returns, with less than 3% of active managers outperforming the benchmark over a five-year period.

Mexico
Mexican equity active managers were unsuccessful in outperforming the benchmark, with 73.33% of managers lagging the S&P Mexico BMI in 2014.  Likewise, 60.53% and 80.56% of managers underperformed the benchmark over the three- and five-year periods, respectively.

Capture

The posts on this blog are opinions, not advice. Please read our Disclaimers.

China Bond Defaults and Indexing the China Bond Market

Contributor Image
J.R. Rieger

Former Head of Fixed Income Indices

S&P Dow Jones Indices

The corporate bond default of Cloud Live Technology Group this week may be a bellwether moment for the Chinese bond markets.  So far, Beijing is allowing the default and not stepping in with a bailout of any kind, and that may be a signal the markets.  The recent Wall Street Journal article China Defaults Test Official’s Resolve by Dinny McMahon says that this could be
“a test of Beijing’s willingness to give market forces a greater role in the economy.”  The globalization of the Chinese bond markets is important for China, and doing so allows more free-flowing information, while bringing transparency of the bond markets toward global standards  will be be critical.

Independent and transparent bond indices play an important role as well.  Indices that use independent data sources and global indexing standards also help raise the level of information about the characteristics of opaque bond markets.

How does this default affect the China bond indices?

The Cloud Live Technology bond issue is a financing of about CNY 480million, a relatively small bond issue – so small it did not qualify for the rules-based broad benchmark S&P China Bond Index, which has a minimum par amount requirement of CNY 1 billion for inclusion.   The bond also did not qualify for inclusion in the S&P China Composite Select Bond Index which is a rules-based index designed to be replicable by passive investors.  To be replicable, due the depth and transparency of the corporate bond markets, the index intentionally excludes corporate bonds unless they are Central State-Owned Enterprises (CSOE’s).

We continue to keep a close eye on the evolution of the corporate bond markets in China; the more transparency and steps towards global standards may help open the market up to a broader global market.

The posts on this blog are opinions, not advice. Please read our Disclaimers.

When Did Everyone Get so Sick?

Contributor Image
Chris Bennett

Former Director, Index Investment Strategy

S&P Dow Jones Indices

While the government squabbles over the future of healthcare, healthcare company executives can just sit back and smile.  Their investors can too.

In the U.S., the healthcare sector significantly outperformed broad parent indices in the first quarter 2015, across capitalization ranges.  On a total return basis, the S&P 500® Health Care sector index gained 6.5% in the first quarter, while the S&P 500 ended the quarter up 1%.  The S&P SmallCap 600® Health Care sector index led the pack, ending the quarter up over 15%, while the S&P SmallCap 600 gained 4%.

Capture

The main benefactors in the U.S. have been mid- and small-cap pharmaceuticals.  The S&P MidCap 400 Pharmaceuticals industry index was up 44% in the first quarter, while the S&P SmallCap 600 Pharmaceuticals industry index was up 32%.  Biotechnology has cooled off slightly in 2015, following a very strong performance in 2014.

This trend is not limited to the United States, however.  Globally, the healthcare sector also outperformed broad market benchmarks.

Capture

So what’s driving this outperformance?  Well for one, there has been significant M&A activity in the space, as consolidation seems to be the name of the game.

These data also imply that the market believes the healthcare sector will continue to be prosperous.  Flows into the space indicate confidence, while recent growth in biotechnology demonstrated that some past wounds have healed.  While we wait to see if these valuations are long on substance, we must ask: Are we all really that sick?

The posts on this blog are opinions, not advice. Please read our Disclaimers.