Get Indexology® Blog updates via email.

In This List

Australian Bonds Delivered Better Risk-Adjusted Return than Equities

Indian Bond Market: Government Bonds Lead

Sustainability Indices: Investment Solutions For Future Generations

Fed's Playing "Whac-A-Risk"

Uncertainty, a Four Letter Word for the Municipal Bond Market

Australian Bonds Delivered Better Risk-Adjusted Return than Equities

Contributor Image
Michele Leung

Former Director, Fixed Income Indices

S&P Dow Jones Indices

Australian equities and bonds both had double-digit returns last year.  Looking at the one-year returns as of Jan 30, 2015, the S&P/ASX Australian Fixed Interest 0+ Index gained 10.22% and the S&P/ASX 200 (TR) rose 12.48%.

While the levels of volatility came down in both markets, the annualized volatility of the S&P/ASX 200 (TR) maintained an elevated level of 11.04%, whereas the annualized volatility of the S&P/ASX Australian Fixed Interest 0+ Index stayed low at 2.19%.

Exhibit 1 shows the risk-adjusted returns of the two indices for the one- and five-year periods, and since year-end 2004.  The one-year, risk-adjusted returns of both indices outperformed the longer periods.  Noticeably, the one-year, risk-adjusted return of the S&P/ASX Australian Fixed Interest 0+ Index came at 4.67, which is four times the equities index’s return for the same period.  The risk-adjusted return seen by the S&P/ASX Fixed Interest 0+ Index is also one of the highest among the major fixed income markets.

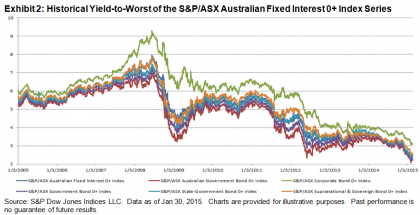
The solid performance in the Australian fixed income market was supported by the strong gains in government bonds.  Contrary to historical performance, the S&P/ASX Corporate Bond 0+ Index underperformed other sector-level indices, despite the hunt for yields continued in other markets.  Yield contraction continued; the yield-to-worst of the S&P/ASX Australian Fixed Interest 0+ Index tightened by 103 bps to 2.42% in the same period, which is the lowest level since the index inception on Dec. 31, 2004 (see Exhibit 2 for historical yield-to-worst performance).  Interesting to note is that the current cash rate is 2.25% and the inflation rate was recorded at 1.70% in the fourth quarter of 2014, according to the Reserve Bank of Australia.

20150225a


20150225b


The posts on this blog are opinions, not advice. Please read our Disclaimers.

Indian Bond Market: Government Bonds Lead

Contributor Image
Utkarsh Agrawal

Associate Director, Global Research & Design

S&P Dow Jones Indices

The Reserve Bank of India recently surprised the market by reducing the repo rate by 25 bps in January 2015, and market experts are expecting further reduction.  While the equity markets were in euphoria, with the S&P BSE SENSEX returning 6.15% in January 2015, the bond market told a different story.

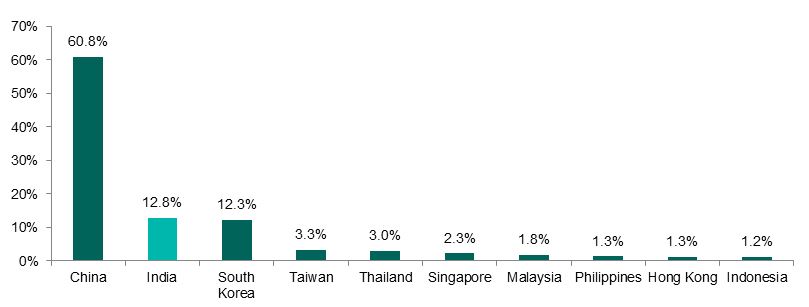
The Indian bond market has the second-highest representation by outstanding par amount in the S&P Pan Asia Bond Index, with nearly 12.8% as of Jan. 30, 2015 (see Exhibit 1).

Exhibit 1: Percentage of Outstanding Par Amount in the S&P Pan Asia Bond Index 

FI 1Source: S&P Dow Jones Indices LLC.  Data as of Jan. 30, 2015.  Past performance is no guarantee of future results.  Charts and tables are provided for illustrative purposes only.

Different countries have different thresholds for outstanding par amount to be included in the S&P Pan Asia Bond Index.  For India, the threshold for sovereign bonds and government bills is INR 30 billion, agency bonds and provincial bonds is INR 15 billion and corporate bonds is INR 3 billion.  This ensures fair representation of Indian bonds in the S&P Pan Asia Bond Index.

All Indian securities in the S&P Pan Asia Bond Index are combined to form the S&P India Bond Index, which is further divided into the S&P India Government Bond Index and the S&P India Corporate Bond Index, and in which government bonds represent nearly 88.5% of the outstanding par amount as of Jan. 30, 2015.

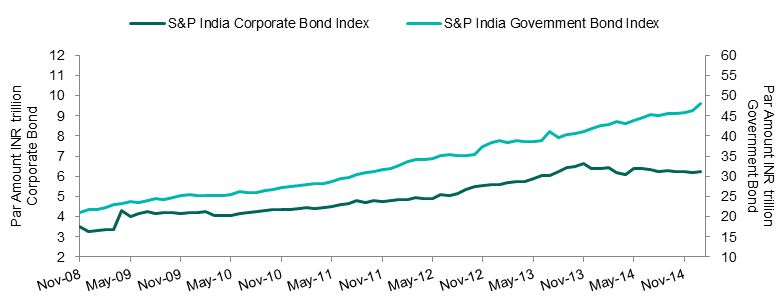
Exhibit 2: Historical Outstanding Par Amount in S&P India Government Bond Index and S&P India Corporate Bond Index.

FI 2Source: S&P Dow Jones Indices LLC.  Past performance is no guarantee of future results.  Charts and tables are provided for illustrative purposes only.

Exhibit 2 shows the historical outstanding par amounts in the respective indices, showing an increase to INR 48 trillion from INR 21 trillion for government bonds and to INR 6 trillion from INR 4 trillion for corporate bonds from November 2008 to Jan. 1, 2015.

During January 2015, the S&P India Government Bond Index returned 1.89%, which was 0.47% greater than the return of the S&P India Corporate Bond Index over the same period.  The reduction in key rates also affected the yields of the bonds, and the effect can be seen in the yield to worst (YTW) graph in Exhibit 3.

The correlation of the repossession rate with the YTW of the S&P India Government Bond Index was almost 82%, while the same correlation measure for the S&P India Corporate Bond Index was 69% for the six-year period ending Jan. 30, 2015.  Over the same period, the annualized return for the S&P India Government Bond Index was 7.66% and that of the S&P India Corporate Bond Index was 9.75%.  The YTW spread between the two indices has also decreased from 245 bps to 67 bps between Nov. 28, 2008, and Jan. 30, 2015.

Exhibit 3: YTW and Total Returns for the S&P India Government Bond Index and S&P India Corporate Bond Index

FI 3Source: S&P Dow Jones Indices LLC.  RBI Repo Rate Source: Reserve Bank of India.  Past performance is no guarantee of future results.  Charts and tables are provided for illustrative purposes.  YTW spread is between the YTW of the S&P India Government Bond Index and S&P India Corporate Bond Index.

To summarize, though the Indian bond market has grown, it is still dominated by government securities and monetary policy therefore plays a crucial role.

The posts on this blog are opinions, not advice. Please read our Disclaimers.

Sustainability Indices: Investment Solutions For Future Generations

Contributor Image
Daniel Ung

Former Director

Global Research & Design

Ever since the launch of the first ethical investment fund by Friends Provident in 1984, socially responsible investing has continued to grow. Global assets under management reached EUR 13.6 trillion in 2012, and mutual fund assets in Europe increased by 19% over just two years, from EUR 199.9 billion in 2010 to EUR 237.9 billion in 2012.

The increasing popularity of sustainability investing can be ascribed to the fact that investors are increasingly aware of the impact of their actions on their surrounding environment and also to the findings of recent academic research which showed that socially responsible companies tend to outperform on a variety of financial metrics in the long term. For instance, Statman (2005) concluded that returns of socially responsible indices were generally higher than those of the S&P 500®. More recent research, written by Eccles et al. (2011), showed that high-sustainability firms dramatically outperformed low-sustainability firms in terms of both the stock market and accounting measures.

Dow Jones Sustainability Indices: An Overview 

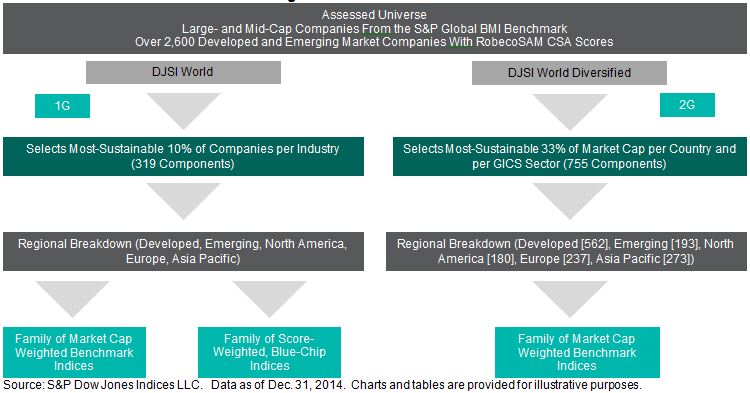
Launched in 1999, the Dow Jones Sustainability™ World Index (the DJSI World) was the first global sustainability index and is highly recognized within the investment community. One of the reasons why the DJSI series has gained widespread acceptance among practitioners lies in the reliability of the analytical inputs used to construct the index. These inputs are provided by RobecoSAM, a renowned investment specialist focused exclusively on sustainability investing. In addition to the DJSI, S&P Dow Jones Indices and RobecoSAM have developed the Dow Jones Sustainability Diversified Indices, which have a broader universe and a lower tracking error to the benchmarks.

Graph2

S&P Carbon Efficient Indices 

S&P Dow Jones Indices has also developed a series of carbon-efficient indices to address investor desire to support environmentally friendly companies and reduce carbon-related risks. The S&P Carbon Efficient Indices select the companies with the least carbon footprint per unit sales of each of the companies within the universe, based on the data compiled by Trucost, an independent specialist research provider.

Case Study: Applying Strategies to Sustainability Indices 

This case study examines whether low volatility strategies may apply to sustainability benchmarks and we have created a simulation that involves selecting the 100 least-volatile stocks from the DJSI Europe Diversified Index every 6 months. The results show that, compared to the benchmark, the annualised excess performance of the strategy is 2.8%, with a corresponding decrease in volatility of 17.5%. This suggests that traditional equity strategies may apply equally well to a sustainability benchmark as to a traditional benchmark.

Graph

Graph1

For more information about this, please read.

The posts on this blog are opinions, not advice. Please read our Disclaimers.

Fed's Playing "Whac-A-Risk"

Contributor Image
Jodie Gunzberg

Former Managing Director, Head of U.S. Equities

S&P Dow Jones Indices

Thanks to better risk controls from banks, the historical credit process is no longer directly related to what the central bank does. For example, if the Federal Reserve buys a trillion dollars’ worth of U.S. government bonds, it doesn’t mean that U.S. banks are going to lend any more money. They need to make their own decisions based on their own views, but given very tight capital ratios, it is easy to bump up against the limits, preventing a credit boom. According to Blu Putnam, Chief Economist at CME Group, “If you don’t have a credit boom, you don’t have inflation.”

One might think that after roughly $3 trillion of quantitative easing some inflation might appear. That hasn’t happened yet or really in the past 20 years when core inflation has been 1%-2%. The core inflation didn’t waver much through the tech boom and bust, the housing boom and big bust, and the economic recovery. So, the correlation between central banking activity and the economy and inflation is lost. Thanks to risk control that stopped the credit boom and inflation.

How has inflation been impacted by the Fed? Given the Fed targets a 2% core inflation rate, they expected to see much higher inflation by now given all of their accommodative easing and zero federal funds rate. The fact that inflation hasn’t occurred, not only in the U.S. but not in Europe nor Japan, shows it is not a problem around the world.  However, inflation is below its target rate so the Fed has to balance that against its desire to move interest policy up some because of the strong labor market.

Fed decision making has become much more complicated since past relationships don’t seem to hold. Tough decisions aren’t always bad decisions, especially with the strong dollar that also keeps inflation down. Low inflation and booming labor markets might make a good decision easier for the Fed, though that decision may have a bigger impact on the equity market than the credit market and inflation.

To hear a more in depth discussion on inflation, central banks and commodities, please watch our interview with Blu.

The posts on this blog are opinions, not advice. Please read our Disclaimers.

Uncertainty, a Four Letter Word for the Municipal Bond Market

Contributor Image
J.R. Rieger

Former Head of Fixed Income Indices

S&P Dow Jones Indices

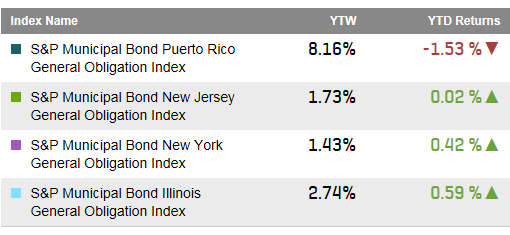
The uncertainty of the future of Puerto Rico municipal bonds continues to weigh on the municipal bond market. Bonds in the S&P Municipal Bond Puerto Rico Index have settled into an average price of just over 50 cents on the dollar with the low point of 47.27 on July 8th 2014.   The index tracks over $73billion in par amount of bonds. Puerto Rico is an important segment of the municipal bond market as many of these federal and state tax-free bonds are held in State based mutual funds. While revenue bonds have held their own, year to date the S&P Municipal Bond Puerto Rico General Obligation Index has returned a negative 1.53%.

The uncertainty of how New Jersey will handle its financial future has resonated with the bond market. While Illinois gets a lot of press it is New Jersey general obligation bonds that are moving more like Puerto Rico bonds in 2015. The S&P Municipal Bond New Jersey General Obligation Index has seen its weighted average yield rise by 21bps in 2015 eerily similar to the rise of yields in the S&P Municipal Bond Puerto Rico General Obligation Index which have moved 22bps higher. The comparison is unfair of course. The weighted average yield of the S&P Municipal Bond New Jersey General Obligation Index ended at 1.73% up from 1.52%. The yields of bonds in the S&P Municipal Bond Puerto Rico General Obligation Index ended at 8.16%. Meanwhile, the yield of the S&P Municipal Bond New York General Obligation Index has dropped by 6bps to 1.43% and the yield of the S&P Municipal Bond Illinois General Obligation Index also has shown an improvement of 3bps to end at 2.74%.

Yields and Total Returns of Select State Municipal Bond Indices

Muni Index Yields 2 20 2015

Source: S&P Dow Jones Indices LLC.  Data as of February 20, 2015.

The posts on this blog are opinions, not advice. Please read our Disclaimers.