Sector allocation is one of the main pillars of equity portfolio management, and its use as a strategy to optimize investment allocations through sector rotation is increasingly abundant. In Australia, the equity market is diversified in sectors, and some of them can be traded through exchange-traded funds, making it possible to implement a rotation strategy.
Based on the S&P/ASX 200, financials is the biggest sector in the Australian equity market by index weight (46%), consisting of 41 stocks traded with a combined value of more than AUD 1.4 billion daily. Information technology (I.T.) is the smallest sector, weighting merely 0.7% and containing three stocks traded with a daily combined value of AUD 26 million.
Despite the fact that the Australian equity market is dominated by the financials and materials sectors, historically, neither of these has persistently outperformed other sectors. Based on annual sector returns in the past 24 years from 1990 to 2013, we observed that sector leaders and laggards rotated every year and no single sector could consistently outperform the rest for extended periods of time. Utilities had the highest annualized return in the entire period, but its annual performance ranked within the top three only in 11 years—less than half of the time over the observed interval. Since sectors can fall in and out of favor, a sector rotation strategy that attempts to identify future sector leaders and laggards could be beneficial.
Our study on sector price momentum strategy shows that sectors with stronger price momentum in recent months tend to outperform in coming months. On the other hand, sectors with weaker price momentum in recent months are more likely to lag behind the market in the next months. A simple, long-only price momentum strategy to invest quarterly in the top three sectors based on a 12-month price change generated an annualized excess return of 4.6% when compared to the benchmark, from December 1990 to June 2014.
Historical Performance and Annual Return of 12-Month Strong and Weak Price Momentum Portfolios
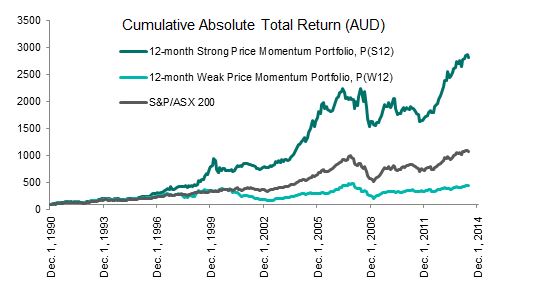
Source: S&P Dow Jones Indices LLC. Data from December 1990 to June 2014. Data are based on the S&P/ASX 200 universe (between March 31, 2000, and June 30, 2014) and the S&P Australia BMI universe (prior to March 31, 2000). Sectors in portfolios are equal-weighted and stocks within each sector are market cap weighted. Performance is based on total return in AUD. Charts and tables are provided for illustrative purposes. Past performance is no guarantee of future results.
Like any typical price momentum strategy, sector price momentum strategy can also result in high portfolio turnover. Without optimization for lower turnover, the 12-month price momentum portfolio in our study recorded 129% annualized turnover. By assuming a one-way replication cost of 50 bps, the annualized return of the 12-month price momentum strategy would decrease by 1.29% to 3.3%. This non-optimized simple strategy remained profitable after replication costs.
The posts on this blog are opinions, not advice. Please read our Disclaimers.