The last month has been marked with worries that the stock market is about to (finally) have a correction and drop some 10% or more. While it is impossible to tell if, or when, this might happen; a few numbers may explain some of the recent action. Stocks were seized with a bit of mania for growth and the internet which over-shadowed other parts of the market. The Dow Jones Internet Index peaked at the beginning of March after climbing almost 70% from the start of 2013. Then it turned down and slid 16.4% to April 11th; as of this afternoon it has regained about three percentage points. One factor in the down move may have been valuation: the PE is over 70 and has risen substantially more than the index level.
The rest of the market hasn’t shown these kinds of large shifts. The S&P 500 is up about 30% since the beginning of 2013. While the PE is at 17, earnings have more than kept pace with stock prices and the PE is up about 21%. Growth stocks slightly out-performed value stocks in the S&P 500 over the last two years. However, since the beginning of March when the Dow Jones Internet index peaked, growth lagged value by a four and a half percentage point spread. The worry of the last six weeks was the passing, at least for now, of that internet infatuation.
The chart shows the S&P 500, the S&P 500 tech sector and the DJ Internet index, all rebased to 100 at the end of 2012. The rise and subsequent decline of the DJ Internet index stands out.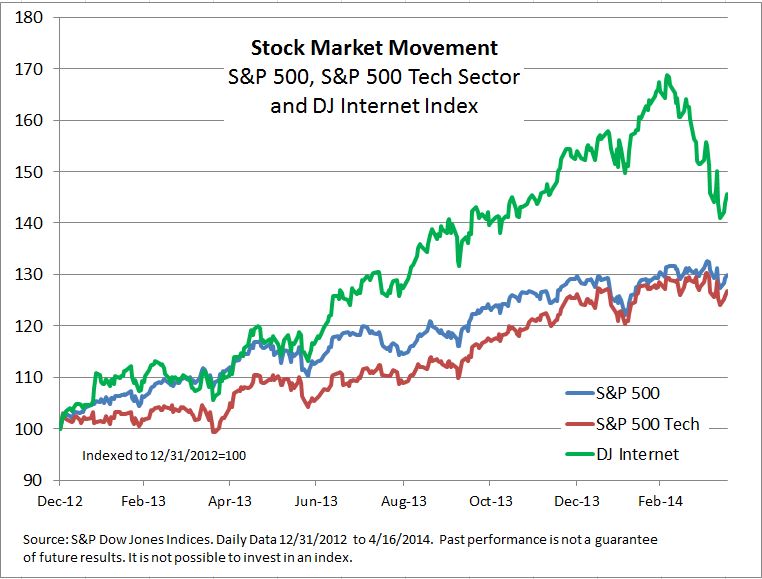
The posts on this blog are opinions, not advice. Please read our Disclaimers.