Someone asked me this last week: “What’s a normal or typical VIX level?” That’s a good question. Here is the answer: 20.2.
And 17.1.
And also 13.0.
Before I go into why it takes at least three numbers to answer this question, let me remind you that the history of the CBOE Volatility Index (VIX) looks like this:
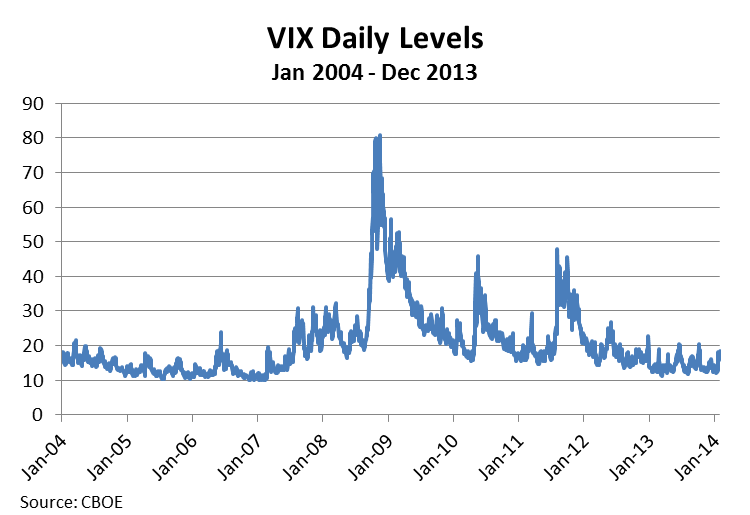
Figuring out the normal VIX level is akin to figuring out how high Alaska, my home state, is above sea level. A skilled topographer could determine an average for the whole state, but this statistic would be skewed by Mount McKinley and the other huge mountains in the Last Frontier. But an average is still useful to know. For VIX, the average daily closing value for the 10 years ending December 2013 was 20.2.
When people worry about outliers skewing the average, they often turn to the median. This is the second number I introduced: 17.1. If you were to order the 2,517 trading days over the last 10 years by their closing VIX value, 17.1 would be next to the 1,259th observation, the middle one.
Finally, you may want to know the mode. The closing VIX value that showed up most – after rounding to the nearest whole number – was the last number I introduced, 13, followed by 12 and other levels just higher than those (see chart below). This surprised me. I would’ve guessed higher.

To go back to the Alaska analogy, if you were to trek across that state, you would spend most of your time trudging through tundra, navigating lakes and rivers, and hiking small and medium sized mountains. You would want to prepare mostly for this. On rare occasions, though, you would come across a breathtaking mountain that would lodge itself in your memory and define your experience.
VIX works in a similar way. Lots of the mundane, but then peaks you won’t soon forget.
——————
Related posts:
You’ve seen VIX. Now finally learn what it means
Turn VIX into information you can use
Where VIX comes from
——————
*By the way, the mean elevation of Alaska is 1,900 feet. Mount McKinley is 20,320 feet.