Get Indexology® Blog updates via email.

In This List

The Power of Dividends: Preferred Stock

Beware the Snows of January

Treasury yields remain lower for the start of 2014

Puerto Rico and Indexing the Municipal Bond Market

Will the Super Bowl Theory Hold Up This Time?

The Power of Dividends: Preferred Stock

Contributor Image
J.R. Rieger

Former Head of Fixed Income Indices

S&P Dow Jones Indices

Similar to fixed income securities, the U.S. Preferred Stock market has started 2014 with positive performance. The S&P U.S. Preferred Stock Index  (Total Return) ended January 2014 up 2.68% .  A good start given the S&P 500 Index (Total Return) was down 3.46%.  As a fixed income comparison the S&P/BGCantor U.S. Treasury Bond  7-10 Year  Index was up 2.98% for the month.

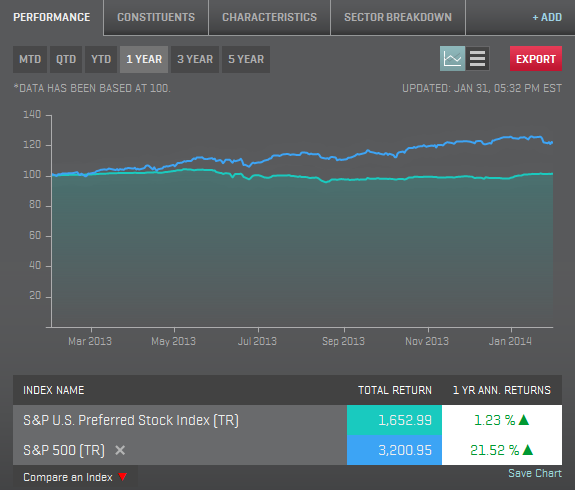
Looking back over a longer period the price return (excluding dividends) of the index declined 5.42% for the twelve months ending January 31st.  The dividend yield of the S&P U.S. Preferred  Stock Index ended January at slightly over 6.9%.   The net result was a positive return of 1.23% during that twelve month period.  Simply put, the dividend income helped keep the returns in positive territory.

The 12 month total returns of both indices are charted below.

12 Month Returns Ending January 2013: S&P U.S. Preferred Index & S&P 500 (Total Return)
12 Month Returns Ending January 2014: S&P U.S. Preferred Index & S&P 500 (Total Return).  Data as of January 31, 2014. Source: S&P Dow Jones Indices.

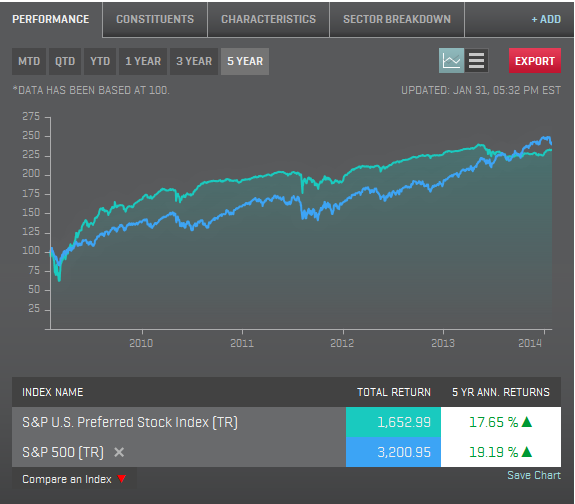
Over the five year period ending January 31, 2014, the S&P U.S. Preferred Stock Index had a five year annualized return of over 17.6% while the S&P 500 returned over 19.1%.  The five year total return values for both indices are charted below.

Five Year Returns Ending January 2014 of the S&P U.S. Preferred Stock Index and the S&P 500 Index (Total Returns)
Five Year Returns Ending January 2014 of the S&P U.S. Preferred Stock Index and the S&P 500 Index (Total Returns).  Data as of January 31, 2014.  Source: S&P Dow Jones Indices.

The posts on this blog are opinions, not advice. Please read our Disclaimers.

Beware the Snows of January

Contributor Image
David Blitzer

Former Managing Director and Chairman of the Index Committee

S&P Dow Jones Indices

The equity markets are getting nervous with the S&P 500 almost 6% off its high, foreign equity markets down at least that much or more and emerging market currencies slipping and sliding.  Normally in such moments there are two opinions: the correction is here versus the economy is solid so don’t worry.  Were the weather warm and sunny, the don’t worry advice would probably rule the day.

The problem is that this winter in much of the US it is unseasonably cold, wet and snowy and that will chill the economy.  Auto sales for January were down from December and below analysts’ forecasts. The ISM Manufacturing Index was down from 56.0 to 51.3 while the ISM Prices Paid series popped up to 60.5 from 54.0.  All negative news for the markets.  Economic releases often seem to follow the herd – if a few indicators are weak early in the monthly cycle, the rest of that month’s reports are as bad or worse. There are a couple of explanations for this pattern. First, on a month to month basis, the weather really does matter.  Shopping days lost to snow and rain means excess inventories which mean reduced orders.  Further, most of the data series are a mixture of hard numbers and estimates in the initial release; after a month or two there are revisions.  The next few economic reports may be no better.  Add to this the Fed’s continuing roll back of QE3 and it looks like the economy won’t do anything good for the markets.

There may be one reprieve on the horizon: Friday’s employment report for January including payroll growth, the unemployment rate and annual revisions to the payroll survey.  December was a weak report and many argued that it was far weaker than reality, so we could see a bounce back in this release.  The annual revisions are likely to boost the numbers for 2013 as well. The unemployment rate is less followed than the growth in payrolls and for now that may be just as well.  The unemployment rate has been dropping not because people are getting jobs, but because they are leaving the labor force.  In any event, the predictions seem to be around 185,000 to 190,000 for payrolls and little change in the unemployment rate.

As to whether the market is correcting or just suffering from the January snows, only time – and hopefully a warmer February – will tell.

The posts on this blog are opinions, not advice. Please read our Disclaimers.

Treasury yields remain lower for the start of 2014

Contributor Image
Kevin Horan

Former Director, Fixed Income Indices

S&P Dow Jones Indices

  • Counter to the thinking that tapering would drive yields higher; Treasury yields have remained lower for the start of 2014.  Additional collateral needs to meet regulatory requirements; risk-off trading and economic uncertainty in emerging market countries such as Turkey have temporarily kept rates lower than the start of the year.  It remains to be seen how long this trend will last as this morning’s Treasury yields are even lower as the ISM Manufacturing number is a 51.3, lower than the forecasted 56.
  • Looking ahead at more of this week’s economic numbers is Tuesday’s December Factory Orders (-1.8% expected) and Wednesday’s MBA Mortgage Applications (-0.2% prior), along with the ADP Employment Change (190k expected, 238k prior).  Thursday’s Initial Jobless Claims (335k expected) will lead into Friday’s Unemployment Rate which is expected to remain unchanged at 6.7%.  These numbers will either solidify the view of an improving economy or could compound doubts about the strength of the economic recovery.
  • The yield on the S&P/BGCantor Current 10 Year U.S. Treasury Bond Index closed at 2.65% for last week as the index returned 0.68% on the week and closed the first month of 2014 at a 3.54%.  The 10-years yield is a much lower level than where it began the year (3.03%).
  • The S&P U.S. Issued Investment Grade Corporate Bond Index closed last week with a return of 0.33% and finished the month returning 1.92%.  The positive performance was spread out amongst the varying issuers of this broad index as investors sought value in the higher credits.
  • High Yield as measured by the S&P U.S. Issued High Yield Corporate Bond Index ended the week down -0.03%, returning only 0.76% for January.  The S&P/LSTA U.S. Leveraged Loan 100 Index experienced similar performance closing the week -0.08% and the month at 0.62%.  In addition to general selling, energy issuer TXU’s performance negatively impacted both the high yield and loan indices.
    2014Jan 10yr Treasury YTW

 Source: S&P Dow Jones Indices, Jan. 31, 2014

The posts on this blog are opinions, not advice. Please read our Disclaimers.

Puerto Rico and Indexing the Municipal Bond Market

Contributor Image
J.R. Rieger

Former Head of Fixed Income Indices

S&P Dow Jones Indices

Puerto Rico Bonds Removed from Investable Municipal Bond Indices

On January 8, 2014, S&P Dow Jones Indices announced that it is removing bonds issued by Puerto Rico and other territories from the S&P National AMT-Free Municipal Bond Index effective  January 31, 2014.

  • Why? Puerto Rico bonds no longer meet the objective of the index.

The objective of the S&P National AMT-Free Municipal Bond Index is to be an investable index that measures the performance of the investment-grade tax-exempt U.S. municipal bond market. The Index excludes those sectors of the municipal bond market that have historically represented higher risks when compared to investment grade General Obligation and essential purpose bonds. For example, excluded are corporate backed municipal bonds, multifamily housing and health care bonds. Puerto Rico municipal bonds are now trading at levels more appropriate for high yield taxable corporate bonds. Puerto Rico municipal bonds also are experiencing varying degrees of liquidity in the secondary market. As a result, Puerto Rico municipal bonds no longer meet the objective established by this investable investment grade index.

  • Puerto Rico bonds will remain in the broader benchmark indices designed for performance measurement and attribution analysis including the S&P Municipal Bond Index, the S&P Taxable Municipal Bond Index and their sub-indices.
Yields of Bonds in the S&P National AMT-Free Municipal Bond Index and the S&P Municipal Bond Puerto Rico Index as of January 31, 2014
Yields of Bonds in the S&P National AMT-Free Municipal Bond Index and the S&P Municipal Bond Puerto Rico Index as of January 31, 2014.  Source:  S&P Dow Jones Indices LLC.  Graph is for illustrative purposes only.

Market data as of January 31, 2014:

Puerto Rico remains a top story in the municipal bond market as it prepares to come to market with more debt.  Bonds issued by Puerto Rico are rated at the lowest investment grade rating by Moody’s, S&P and Fitch.  Each ratings service has recently announced the possibility of downgrade to below investment grade.

Since the start of 2014, the average yield of bonds in the S&P Municipal Bond Puerto Rico Index have ended unchanged at  7.44%.  The yield got as low as a 7.19% on Friday the 24th  but has risen by 25bps since then bringing bond prices back down.  Throughout the ups and downs, the index has seen a year to date total return of 1.33% helping to offset its 2013 negative return of -20.46%.

Investment grade bonds tracked in the S&P National AMT-Free Municipal Bond Index have seen yield drop by 33bps this year to end at 2.78%.  The drop in yields pushes bond prices up resulting in a positive 2.12% total return year to date.

High Yield municipal bonds tracked in the S&P Municipal Bond High Yield index have seen a positive 2.89% return year to date with yields of bonds in this index dropping by 30bps during January to end at 6.46%.

Link to the original announcement  http://us.spindices.com/documents/index-news-and-announcements/20140108-muni-national-series-methodology-update.pdf?force_download=true

The posts on this blog are opinions, not advice. Please read our Disclaimers.

Will the Super Bowl Theory Hold Up This Time?

Contributor Image
Howard Silverblatt

Senior Index Analyst, Product Management

S&P Dow Jones Indices

Every once and a while there are some events which are totally irrational, but they happen. You toss a coin in the air and it comes up heads five times in a row.  The chances of it being heads on the next toss is still 50% – but five in a row. In the market we have a few strange items as well; statements which do not follow logic or analytical analysis.  Two for January are below.

SUPER BOWL THEORY IS CORRECT 37 OF THE 47 YEARS
Quarterbacked by Howard Silverblatt, with special teams player David Silverblatt

The Super Bowl Predictor Theory says that the market will gain for the year if an NFC (National Football Conference) team or an AFC (American Football Conference) team with an NFC origin wins the game, otherwise the market will fall – totally irrelevant items to the market. However, the indicator has been correct 37 of the last 47 years, or 78.7% of the time, on a total return basis for the S&P 500. On a stock appreciation basis, 2011 (which lost 0.003% but gained 2.11% on a total return basis), and 1994 (which lost 1.54% and gained 1.32% on total return basis) couldn’t be counted; meaning the count would be 35 of 47, or 74.5%. Either way, 78.7% on a total return basis or 74.5% for stock alone, it is a much better track record than most stock pickers. This year’s game sets the NFC Seattle Seahawks against the AFC Denver Broncos. If Seattle wins the theory says that the S&P 500 will be up this year; if Denver wins the theory says that the market closes down.

AS GOES JANUARY, SO GOES THE YEAR
‘As goes January, so goes the year’ is an old Wall Street saying. What makes the saying irrational is that January is only one of twelve months, and that there is no rational reason to draw such a conclusion. However, the problem is ‘As January goes, so goes the year’ has been right for 62 of the last 85 years, or 72.9% of the time: 51.8% of the time January and the market moved up together and 21.2% of the time they move down together. January has been up 55 times since 1929, with that year being up 44 times, or 80% of the time. The market closed down 30 times in January over that time period, with the year being up 12 times, or 40% of the time. This January the market was down 3.56%, and down 3.46% with dividends – root for Seattle.

———————————–

Please note that the statistical data is based on publicly available information, most of which is available in S&P products such as Capital IQ, Compustat Research Insight and S&P Index Alert.  Analysis and projections are my own, and may differ from others within S&P/McGraw Hill.  Nothing presented is intended to, or should be interpreted as, a buy/sell/hold recommendation.
My notes vary in topics, but are market related. The intent is to quickly inform. The assumption is that you don’t need a basic education, editorial or sales pitch, just specific facts and maybe some observations. If the information does not suit your needs, please e-mail me and I will take you off the list. Unless otherwise noted all data is for public dissemination, and may not be used for commercial purposes.  Finally, any incoming correspondence from you will be considered confidential unless you specify otherwise.
DISCLAIMER
The analyses and projections discussed within are impersonal and are not tailored to the needs of any person, entity or group of persons.  Nothing presented herein is intended to, or should be interpreted as investment advice or as a recommendation by Standard & Poor’s or its affiliates to buy, sell, or hold any security.  This document does not constitute an offer of services in jurisdictions where Standard & Poor’s or its affiliates do not have the necessary licenses. Closing prices for S&P US benchmark indices are calculated by S&P Dow Jones Indices based on the closing price of the individual constituents of the Index as set by their primary exchange (i.e., NYSE, NASDAQ, NYSE AMEX).  Closing prices are received by S&P Dow Jones Indices from one of its vendors and verified by comparing them with prices from an alternative vendor. The vendors receive the closing price from the primary exchanges.  Real-time intraday prices are calculated similarly without a second verification.   It is not possible to invest directly in an index.  Exposure to an asset class is available through investable instruments based on an index.  Standard & Poor’s and its affiliates do not sponsor, endorse, sell or promote any investment fund or other vehicle that is offered by third parties and that seeks to provide an investment return based on the returns of any S&P Index.  There is no assurance that investment products based on the index will accurately track index performance or provide positive investment returns.  Neither S&P, any of its affiliates, or Howard Silverblatt guarantee the accuracy, completeness, timeliness or availability of any of the content provided herein, and none of these parties are responsible for any errors or omissions, regardless of the cause, for the results obtained from the use of the content.  All content is provided on an “as is” basis, and all parties disclaim any express or implied warranties associated with this information.  The notes and topics discussed herein are intended to quickly inform and are only provided upon request.  If you no longer wish to receive this information or if you feel that the information does not suit your needs, please send an email to Howard.silverblatt@spdji.com  and you will be removed from the distribution list.  A decision to invest in any such investment fund or other vehicle should not be made in reliance on any of the statements set forth in this document.  Standard & Poor’s receives compensation in connection with licensing its indices to third parties.  Any returns or performance provided within are for illustrative purposes only and do not demonstrate actual performance.  Past performance is not a guarantee of future investment results.  STANDARD & POOR’S, S&P, and S&P Dow Jones Indices are registered trademarks of Standard & Poor’s Financial Services LLC.

The posts on this blog are opinions, not advice. Please read our Disclaimers.