In terms of fixed-income investing, 2013 is a year for the history books. Consequently, the question of what will 2014 bring for the fixed income investor arises. Some significant understanding of future fixed-income investing can be inferred from the recent past. The equity market had a very successful 2013 as the S&P 500 Index returned 29.6% for the year. Year-to-date, the stock market is down 0.38%, though we’ve only had a few trading days so far in 2014. For fixed income investments, yields have been on the rise going into the New Year and there are questions of the declining benefits of Fed stimulus, the timing of the tapering, and improving economics measured by jobs, manufacturing, and housing. This begs to question how much volatility equity and fixed income investments may experience.
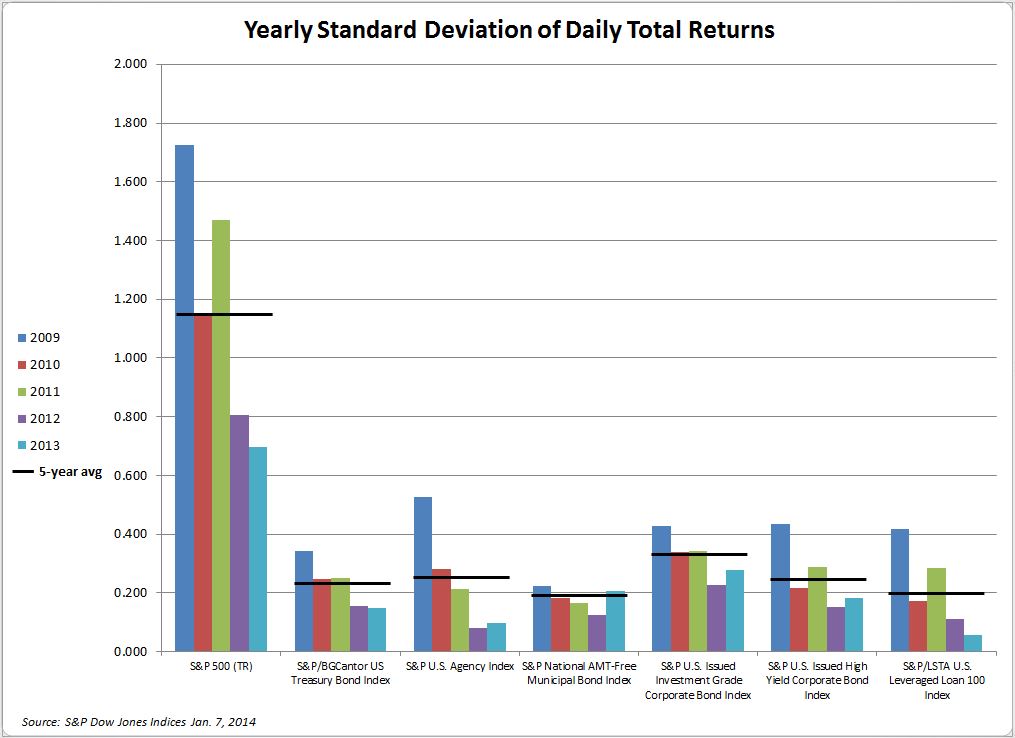
In order to get a comparison between the two asset classes, the chart below looks at the daily total return of the S&P 500 Index and S&P Dow Jone’s fixed income indices over the past five years. The yearly standard deviation or volatility of daily returns for the S&P 500 has declined since the 2008 financial crisis, though with a 2013 volatility of 0.69, it is still higher than any of the fixed income indices. Treasury and senior bank loans, as measured by the S&P/BGCantor US Treasury Bond Index and the S&P/LSTA U.S. Leveraged Loan 100 Index, were the two fixed income indices whose volatility declined in 2013 to -0.147 and 0.056 respectively. The yields of indices may have started last year and ended this year rather close to each other with U.S. Treasuries, U.S. agencies, and investment grade corporates 30 to 50 basis points wider than they were at the start of the year. U.S. high yield and senior loans were tighter by 18 and 64 basis points, respectively. Given all the press that municipal bonds had received regarding Puerto Rico and Detroit throughout the year, it comes as no surprise that the S&P National AMT-Free Municipal Bond Index ended the year 100 basis points wider than it did at the start of the year when it was at a 3.06%. The S&P National AMT-Free Municipal Bond Index’s volatility rose 0.08 in 2013 to 0.206 from 2012’s level of 0.126. The S&P U.S. Issued Investment Grade Corporate Bond Index was not far behind municipals with an increase of 0.05, while the S&P U.S. Issued High Yield Corporate Bond Index’s volatility rose by 0.03 to 0.181.
Credit stories will continue to be an important factor in 2014 along with the changes in rates. With lower volatility to equity and a more predictability of returns, investors should take the volatility of the differing fixed income products compared with equity into consideration as they invest with the differing asset classes.