


Just an aggravating stat for all those who keep talking about the enormous volatility. The historical average intraday high price over the intraday low price is a swing of 1.482%, with a 1% variance (high / low) occurring 71.3% of the time over the past 50 years. The 2013 year-to-date average is a 0.916% variance, and has occurred 34.5% of the time. 2008 had a 90.1% rate, an average daily high / low of 2.809%, with 27 times, over 10% of the trading days, when the market opened up or down over 1% and closed more than 1% in the other direction (14 opening higher than 1% and closing over 1% down, and 13 opening off 1% and closing up at least 1%), and that was just on the open and close. 2008 had 6 days of at least a 10% spread between the high and the low – think of the S&P moving 160 points or the Dow 1,500 points intraday. More volatility then we we’ve had recently, yes, as long as recently is very short term.
The posts on this blog are opinions, not advice. Please read our Disclaimers.Volatility - Are You The New Kid On The Block?
IMF Cuts US Growth Forecast, Market Reacts
A PIP Off the Old Block
Bank loan tracked by the S&P/LSTA U.S. Leveraged Loan Index is down 0.34% so far in June while high yield bonds are down 1.51%.
Shorter Duration Munis Hold Up While Longer Duration Munis Tumble
IMF Cuts US Growth Forecast, Market Reacts

- Categories Blitzer's Insights, S&P 500 & DJIA
- Tags Economic Growth, IMF
The IMF released its latest forecast of US economic growth and US economic policy this afternoon, sending the S&P 500 and the Dow into negative territory. While the market response is likely to be forgotten by next Monday, the IMF’s comments are worth consideration. The forecast sees 1.9% real GDP growth in 2013, 2.7% in 2014 and 3.5% in 2015 — the 2013 number is a bit lower than others while the 2014 and 2015 figures look strong. Inflation is expected to remain low and unemployment will drift down a bit, averaging 7.5% this year and 7.2% next year.
The IMF applauds Fed policy, commenting “the Fed appropriately continued to add monetary policy accommodation over the past year…” but does not offer any comments on what the central bank might do next. On fiscal policy (taxes and spending) the comments are more pointed and less complimentary: “On the fiscal front deficit reduction in 2013 has been excessively rapid and ill-designed.” The IMF calls for repealing the sequester and replacing it with a more balance and back-loaded program of fiscal policy and for a early increased in the debt ceiling.
While the number one short term concern for the market is what the Fed does next, the IMF’s comments about the debt ceiling and fiscal policy point to the key issues for how the market behaves in the second half of 2013.
The posts on this blog are opinions, not advice. Please read our Disclaimers.A PIP Off the Old Block

- Categories Equities, Strategy
- Tags backtests, equal weighting, S&P 500
The staff of the Financial Industry Regulatory Authority (FINRA) recently issued an opinion letter discussing the use of “pre-inception index performance (PIP)” data in communications about exchange-traded financial instruments. Importantly, the letter permits the use of PIP data (i.e., backtested or simulated results) in presentations to institutions (although not to retail investors).
No good deed goes unpunished, and FINRA’s decision was not greeted with unanimous praise. Some critics have cautioned that backtested data should be taken with “more than a few grains of salt.” Although we’re quite pleased with FINRA’s action, we appreciate the note of skepticism. Backtests are useful analytic tools – and they should definitely be taken with a grain of salt.
We’ve previously discussed this issue at some length in a conceptual context. Another way to assess backtest results, of course, is simply to compare (where data permit) simulated with live results for the same index. As a simple example, consider the S&P 500 Equal Weight Index, which launched in January 2003. We have 12 years of simulated data (starting 1991), and, as of this writing, just over 10 years of live data. Comparing monthly return data for the backtest (PIP) period with the live period shows some remarkable similarities:
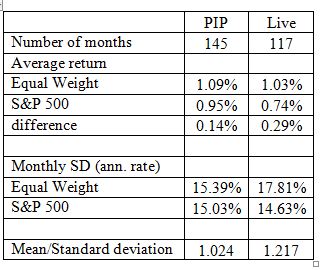
If anything, performance improved during the live period, in both absolute and risk-adjusted terms.
Of course not all backtests are alike, and of course equal-weighting is a much less complex portfolio construction rule than many others in current use. We don’t believe that backtests are always fair and unbiased predictors of future results. But sometimes they are. Judicious use of PIP can add to the index user’s insight.
The posts on this blog are opinions, not advice. Please read our Disclaimers.Bank loan tracked by the S&P/LSTA U.S. Leveraged Loan Index is down 0.34% so far in June while high yield bonds are down 1.51%.

- Categories Fixed Income
- Tags bond, High Yield, Investment Grade, Junk, leverage, loan, senior, Treasury
U.S. Treasury Bonds:
Treasury notes and bond as measured by the S&P/BGCantor US Treasury Bond Index started the year in negative territory, finally getting their head above water on a consistent basis around the beginning of April. The positive returns did not last long as they slipped into negative territory on May 13th and have remained at a loss since the 17th. The current year-to-date return of this index is -0.69%.
U.S. Corporate Bonds & Senior Loans:
Investment grade bonds as measured by the S&P U.S. Issued Investment Grade Corporate Bond Index have not performed any better than Treasuries. The yield of the corporate index widened by 40 basis points since the beginning of the month to a current 2.87%. The month-to-date return of this index currently stands at -0.75% while its year-to-date return turned negative on the 28th of May and is currently -1.41%.
The year-to-date return of the S&P U.S. Issued High Yield Corporate Bond Index has dwindled from its May 9th high of 5.43% to a current level of 2.25%. Similarly, the S&P/LSTA U.S. Leveraged Loan 100 Index, which measures the performance of below investment grade loan facilities, has gone from a May 22nd year-to-date high of 3.32% to a 2.5%. Senior loan’s lower return volatility to interest rate movements is apparent as high yield bonds have dropped 60 basis points from their highs, while senior loans have only given up 25 basis points. Up to this point, loans are outperforming high yield with a 2.5% year-to-date total return.
Source: S&P Dow Jones Indices LLC and/or its affiliates. Data as of Jun. 13, 2013. Past performance of the Index is not an indication of future results. Please refer to the methodology paper for the Index, available at www.spdji.com or www.spindices.com for more details about the index, including the manner in which it is rebalanced, the timing of such rebalancing, criteria for additions and deletions, as well as all index calculations. It is not possible to invest directly in an Index.
The posts on this blog are opinions, not advice. Please read our Disclaimers.Shorter Duration Munis Hold Up While Longer Duration Munis Tumble

Duration is everything in a rising interest rate market.
Short term municipal bonds have fared better than their longer term counterparts as money moves out of bond funds.
The S&P Short Term AMT-Free Municipal Bond Index has seen its weighted average yield remain fairly steady and has recorded a modestly down June so far of -0.11%.
One year municipal bonds tracked in the S&P AMT-Free Muni Series 2014 Index have seen a positive return of 0.02% with its yield dropping by 1bp month to date.
Five year bonds tracked in the S&P AMT-Free Muni Series 2018 Index have seen yields rise by 17bps pushing prices down and recording a negative 0.7% return month to date.
Ten Year bonds tracked in the S&P AMT-Free Muni Series 2023 Index have returned a negative 1.81% as its yield has risen by 21bps. The yield of these non-callable, investment grade bonds is 2.85%. Using a tax rate of 35%, the Taxable Equivalent Yield of these investment grade municipal bonds has moved to 4.38%.
Longer municipal bonds, in the 20 year and longer range, are tracked in the S&P 20+ Year Municipal Bond Index. That index is down 2.4% in June so far with yields rising by 45bps since May.
For June, Puerto Rico has moved the most of any state or territory down 2.43%. The longer duration characteristics of bonds from Puerto Rico tracked in the S&P Municipal Bond Puerto Rico Index isn’t helping as interest rates rise.
High yield municipal bonds are off 2.12% for June so far. Helping to push down the high yield market is the long duration tobacco settlement bond sector, the S&P Municipal Bond Tobacco Index is down 4.32% month to date. (In comparison, the S&P U.S. Issued High Yield Corporate Bond Index is down 1.51% month to date)
The posts on this blog are opinions, not advice. Please read our Disclaimers.