Get Indexology® Blog updates via email.

In This List

Unconventional Sources of Retirement Income

Large-Cap Energy Stands Out in a Year of Low Volatility

Quality Over Quantity: China’s Economic Growth Focus in 2018 – Part 1

The Passive Canon

It May Not Be Time To Fear Stocks Yet, But Perhaps Real Estate

Unconventional Sources of Retirement Income

Contributor Image
Peter Tsui

Former Director, Global Research & Design

S&P Dow Jones Indices

The three pillars of conventional retirement income are social security retirement benefits, pensions from employment, and personal savings. There are, however, other potential sources of retirement income that are not mentioned often enough. These include (a) the cash value of one’s whole life insurance policy, (b) the home equity value of one’s residence, and (c) the pre-funded nature of the long-term care insurance policy.

Let’s dig a bit deeper into the nontraditional sources noted above.

(a) The premium for a whole life insurance policy is generally much higher than that of a term life insurance policy. Hence many tend to shy away from purchasing the whole life insurance. However, the premium paid for a whole life policy can be viewed as consisting of a premium for an equivalent term life policy plus a contribution to an investment account maintained for the insured by the insurance company. The balance in this investment account is known as the cash value of the whole life insurance policy. As time passes, if one is still alive, this cash value will also grow, due to the fact that new premiums are adding to the account balance and the entire balance is increasing at a rate tied to the performance of the insurance company’s general account.

When the insured individual gets older, say age 75, if the objective of protection is no longer an issue, the insured has the option to surrender his policy and tap into the cash value as a source of income.

(b) The home equity value of one’s residence can also be accessed by using the property as collateral for either a home equity loan or a reverse mortgage. The advantage of this type of secured borrowing is that one can continue to stay in one’s residence without resorting to a sale.

(c) The last source, the long-term care insurance policy, is intended to provide funding for healthcare-related expenses, which can be expected to be ever-present in old age. A long-term care policy, purchased when one is younger, behaves as if it’s prefunding one’s late-life healthcare expenses on a level-payment basis. In this way, even though it is a non-cash source of income, since it takes care of the healthcare-related expenses when they’re incurred, it can be thought of as a cash item. Typically, for the long-term care policy to be activated, a doctor’s approval is required by the insurance company, and the insurance company would reimburse the healthcare providers directly.

For one to feel secure in retirement, monthly cash incomes are needed to take care of both the core expenses and discretionary ones (such as for travel and entertainment). What has often been overlooked are the benefits from the unconventional sources, both as additional sources of cash (for example, from one’s cash value account or home equity loans) or as indirect non-cash contributions (such as the expenses covered by one’s long-term insurance). These additional sources of support need to be taken into account in one’s financial life planning as well.

The posts on this blog are opinions, not advice. Please read our Disclaimers.

Large-Cap Energy Stands Out in a Year of Low Volatility

Contributor Image
Anu Ganti

U.S. Head of Index Investment Strategy

S&P Dow Jones Indices

Most sentient investors are aware of the low volatility that characterizes the current environment, with the S&P 500®’s trailing twelve-month annualized volatility at approximately half its level from a year ago. This trend was driven in part by some significant negative inter-sectoral correlations, for example between information technology and real estate versus financials, and energy versus information technology (see Exhibit 1).

Going a step further at the sector level, we observe decreases in volatility across the majority of sectors. Most notably, energy had the largest decrease (see Exhibit 2).

As illustrated in the most recent sector dashboard, the S&P 500 Energy sector’s trailing twelve-month annualized volatility was 13.2% as of Dec. 29, 2017—approximately half the sector’s 23.6% volatility from the prior year, with volatility declining steadily over the past twelve months. Historically, energy volatility has ranked roughly at the median of all sectors. We witnessed an aberration in recent years, as the sector’s volatility reached peak levels. However, this trend has reverted during the past year.

Market volatility can be understood in terms of two components: dispersion and correlation. Dispersion measures the degree to which index constituents perform differently, and correlation measures the tendency of index constituents to rise or fall at the same time. The decline in energy sector volatility has been driven by declines in both correlation and dispersion.

Exhibit 3 shows that the average trailing twelve month dispersion for the S&P 500 Energy sector was 13.4% as of Dec. 29, 2017, versus 20.5% one year prior. Similarly, the average trailing twelve month correlation for the S&P 500 Energy sector was 0.43, versus 0.57 one year before.

While energy was the second-worst-performing sector in 2017, performance has picked up so far in 2018, with the sector up 5.9% for the month as of Jan. 19, 2018, aided by strengthening oil prices. Will this performance tailwind reverse last year’s decline in volatility? We shall wait and see.

The posts on this blog are opinions, not advice. Please read our Disclaimers.

Quality Over Quantity: China’s Economic Growth Focus in 2018 – Part 1

Contributor Image
Jack Jiang

Senior ETF Specialist, Index and Quantitative Investment

ICBC Credit Suisse Asset Management (International) Co., Ltd.

The Central Economic Work Conference (CEWC) was held in Beijing on 18-20 December, 2017. As the first CEWC after the 19th Party Congress, it set the tone for China’s central government’s economic policies in 2018. They are crucial to the long-term development of the world’s second-largest economy.

Highlights of the CEWC

(1) High-quality development over GDP targets

CEWC emphasized the quality of the economic development over specific GDP targets. The government will likely unveil its GDP growth target at “around 6.5%” during the National People’s Congress in March 2018 instead of “6.5% or higher if practically possible” in 2017. The government will follow its previous guideline of “making progress while maintaining stability” and keep economic growth within a “reasonable range.”

(2) Three key focuses: prevention of major financial risks, poverty alleviation, and pollution reduction

 Preventing major financial risk. The government will focus on containing major financial risks to form a “virtuous cycle” among the financial, real and property sectors, as well as within the financial system.1 There will also be increasing efforts to crack down the illegal activities in the banking, securities and insurance sectors as well as online finance.

Poverty alleviation. President Xi pledged to lift all rural residents above China’s poverty line by 2020. The central government will also step up its supervision of local government bodies while allocating more fiscal resources to welfare, education and healthcare as well as public services in rural area.

– Pollution reduction. The CEWC targeted to “significantly reduce” the gross emissions of major pollutants with a specific focus on air pollution control. Previous measures such as reducing industrial activities during the winter heating season will continue. China will also examine its industrial structure, energy structure and transportation structure in order to achieve eco-friendly development.

  (3) Monetary and fiscal policies

Monetary policy. The CEWC said China will implement prudent and neutral monetary policy2.  However, following the Fed’s rate hike decision in December, the PBoC raised interest rates on MLF and reverse repo operations by merely 5bps. The move was pre-emptive but it indicated that the PBoC is ready to use interest rates and other measures to ensure financial stability if volatilities are triggered by external factors.  

– Fiscal policy, the government will implement a proactive fiscal policy in 2018. In particular, the CEWC said the government will improve its supervision over local government debts. That being said, strategic projects related to government-led regional integration plans (such as the Guangdong “Bay area” blueprint, Xiong’an new district, and the Yangtze River Delta city-clusters) will still be supported by government budget spending and debt issuance.

(4)  Currency

The CEWC confirmed that China will maintain stability of the RMB exchange rate at a reasonable equilibrium level. Although the global financial market volatility and the interest rate hike of the Federal Reserve will weigh on the RMB exchange rate, the growth of Chinese economy and the ongoing RMB internationalization will offset the impact. We will expect two-way fluctuations of the RMB’s exchange rate in 2018

(5) Property

The CEWC repeated that the government will establish the “long-term price mechanism” for the property market, with “equal emphasis on rentals and sales.” It will encourage the professional and institutional participation in the rental market. We do not expect loosening of existing restrictions on purchase and resale to curb the property price. The development of private rental and public social housing may pick up. Going forward, the uncertainty on the property sector has somewhat increased.

The posts on this blog are opinions, not advice. Please read our Disclaimers.

The Passive Canon

Contributor Image
Jamie Farmer

Former Chief Commercial Officer

S&P Dow Jones Indices

A “canon” refers to the core texts that constitute the doctrine of a specific discipline.  Different faiths hold certain letters and books as canon.  The same can be said of a body of works that shaped and directed a culture.  The original Ghostbusters is, obviously, a canonic comic film and anyone who suggests otherwise should be met with scorn and opprobrium.

While presenting recently to some indexing neophytes, I referenced a few of the important academic works that are foundational in the development of passive investing.  Serendipitously, I discovered during my prep that the English word “canon” comes from the Greek “κανών”, which can be translated as “rule” or “measuring stick”.  And benchmarks and indices are, of course, the measuring sticks for investment performance.   How cool is that?

Here, therefore, are the works from my list.  Seven texts from The Passive Canon

“Portfolio Selection” by Harry Markowitz in The Journal of Finance (1952) – in this ground-breaking work, Markowitz introduces Modern Portfolio Theory (MPT).  He demonstrated that the risk/return profile of a portfolio is determined by combining the expected risk and return of its component securities and their relative correlations.  In doing so, he underscored the benefits of diversification – i.e. that a broad portfolio of holdings can offer greater risk-adjusted returns.

“The Performance of Mutual Funds in the period 1945-1964″ by Michael Jensen in The Journal of Finance (1965) – Jensen offered one of first studies that indicated active fund managers tend to underperform their benchmarks.  This is a forebear of S&P DJI’s SPIVA research, which for 15 years has been the de facto scorecard for the passive vs. active debate.

“Random Walks in Stock Market Prices” by Eugene F. Fama in Financial Analysts Journal (1965) – herein, Fama coined the term “efficient market”.  He conducted extensive research on stock price patterns and their unpredictability, positing that prices quickly incorporate available information.  The underlying notion of this “Efficient Markets Hypothesis” is that it is very difficult, if not impossible, to consistently identify individual securities that are mispriced relative to their intrinsic value.

“A Random Walk Down Wall Street” by Burton G. Malkiel (1973) – Malkiel drew attention to concept of an index fund when he complained that “Fund spokesmen are quick to point out you can’t buy the market averages.  It’s time the public could.”  Three years later, the first mass-marketed index fund was introduced.

“Challenge to judgment” by Paul Samuelson in The Journal of Portfolio Management (1974) – any article that John Bogle credits as his inspiration for the first index mutual fund must be canonical.   Samuelson contended there was insufficient evidence that money managers were skilled enough to produce consistent, market-beating returns.  He mused, “At the least, some large foundation should set up an in-house portfolio that tracks the S&P 500 Index — if only for the purpose of setting up a naive model against which their in-house gunslingers can measure their prowess.”  Shortly thereafter, Mr. Bogle picked up that gauntlet.

“The Loser’s Game” by Charles Ellis in Financial Analysts Journal (1975) – from the paper: “…most institutional investment managers continue to believe, or at least say they believe, that they can and soon will again “outperform the market.” They won’t and they can’t.”  Written 40 years ago, Ellis’s proclamation could have easily come from today’s news.  He points to a few reasons for this, chief among them that the markets are increasingly professional – active managers are trading against one another and both sides of that trade can’t be right.

“The Arithmetic of Active Management” by William Sharpe in Financial Analysts Journal (1991) – Sharpe lays out a clean, elegant construct that explains much of the underperformance of active:  1) Since passive investors own a pro-rata share of the market, active and passive investors in aggregate own the same portfolio; 2) Active management is inherently more expensive than passive management; 3) Therefore, “properly measured, the average actively-managed dollar must underperform the average passively-managed dollar, net of costs.”

Record-breaking passive asset flows are a very “now” phenomenon, but they’re properly evidence of an incremental advance rather than a seismic shift.  This sampling of works – four of which come from Nobel Prize winners (Markowitz, Fama, Sharpe and Samuelson) – are the incremental contributions that have made it possible.

The posts on this blog are opinions, not advice. Please read our Disclaimers.

It May Not Be Time To Fear Stocks Yet, But Perhaps Real Estate

Contributor Image
Jodie Gunzberg

Former Managing Director, Head of U.S. Equities

S&P Dow Jones Indices

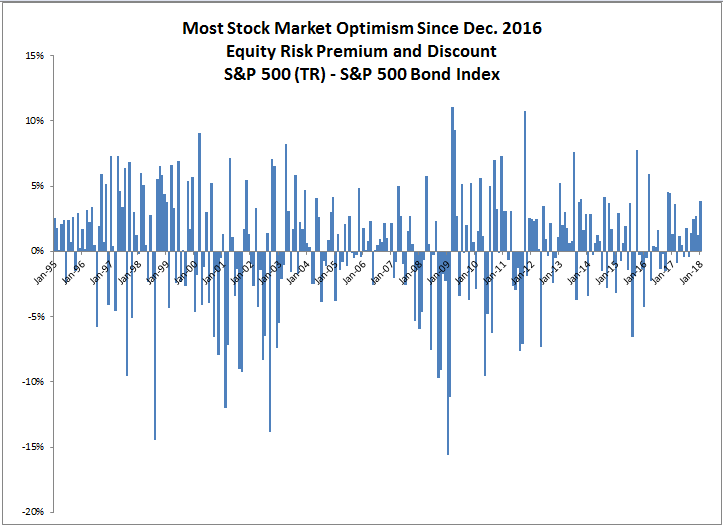
Euphoria seems to be taking over the stock market with frequent stories of new highs – but what is more important is how strong the stock market performance is relative to the bonds.  Month-to-date through Jan. 18, 2018, the S&P 500 is outperforming the S&P 500 Bond Index by 3.8%, the most since Dec. 2016, when the monthly outperformance was 4.5%.  The comparison between the stocks and bonds of the S&P 500 shows market sentiment by calculating the the equity risk premium or discount.

If there is equity outperformance, it is called an equity risk premium, and it indicates that market participants may be more inclined to participate in the upside of stocks rather than to be protected by the limited downside risk of the bonds. Conversely, if the bonds outperform the stocks, it is called an equity risk discount, and it reflects bearish feelings, so market participants may be more likely to capitalize from the bonds.

Not only is the sentiment highly positive now by magnitude, but this is the 5th consecutive month with a positive equity risk premium. It is the first time since the 5 months ending in July 2013 that the S&P 500 outperformed the S&P 500 Bond Index for this long.

Source: S&P Dow Jones Indices

As of now, this market seems fearless and there may be no need to worry yet.  Through history, equity market discounts are observed before big stock market declines.  In 1998, the S&P 500 Bonds outperformed the stocks in May before the S&P 500 top in June.  Similarly in 2000, there was an equity risk discount in July before the August top.  Again in July 2007 before the Oct top that year, and also this pattern was observed in March and April 2011, June and July of 2015 as well as in Sep. and Nov. that year.  If this pattern repeats, an equity risk discount should be observed before a major stock market decline.

Source: S&P Dow Jones Indices

The same concept applied above can be applied for a gauge on sector sentiment by applying the formula to the equivalent S&P 500 sectors and S&P 500 Bond Index sectors.  On average, the market sentiment is slightly positive in every sector, but there is a slightly bigger monthly equity risk discount (measure of pessimism) than equity risk premium (measure of optimism) as measured by the magnitude of equity risk premiums and discounts monthly starting in Jan. 1995.  Materials is the only sector that shows slightly bigger premiums.

Source: S&P Dow Jones Indices. Real estate data is as of Nov. 2001.

Currently, there are 8 of 11 sectors with positive sentiment with pessimism in real estate, telecom and utilities.  While utilities is the most bearish with an equity risk discount of 5.8%, it is less negative than the 6.2% discount last month, but is the biggest consecutive monthly discount since Feb. 2009.  On the other hand, the equity risk discount on real estate has increase from 0.4% last month to 5.5% and is the biggest monthly discount since Aug. 2013.  The concern in this sector is justified by the fear of rising rates, especially in the 10-year that impacts mortgages.

Source: S&P Dow Jones Indices

The posts on this blog are opinions, not advice. Please read our Disclaimers.