Get Indexology® Blog updates via email.

In This List

A simple model of aggregate dividend growth

Japanese Market Participants Accessing U.S. Treasuries (Part 2)

Japanese Market Participants Accessing U.S. Treasuries (Part 1)

Lessons From Canada’s Top Pension Managers

Oil's Price Rise Boosts All Equity Sectors, But One

A simple model of aggregate dividend growth

Contributor Image
Erik Norland

Executive Director and Senior Economist

CME Group

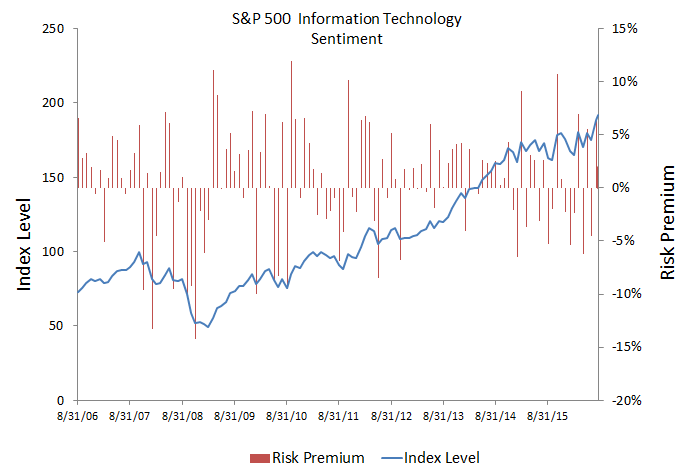
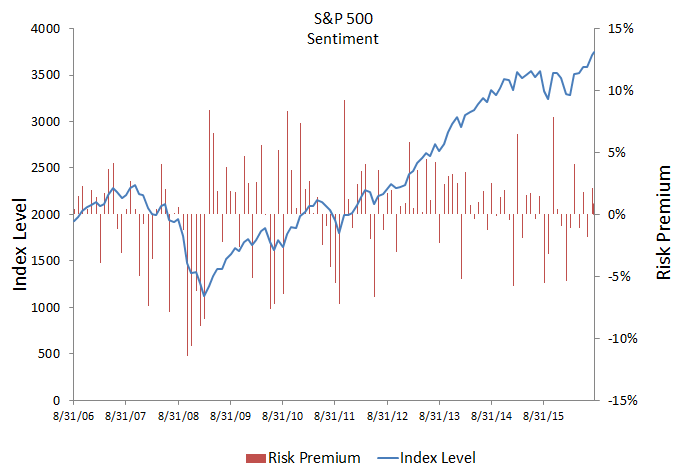
Dividends are getting more and more into the spotlight as overall corporate earnings growth continues to face many challenges in a low inflation and relatively slowly growing world.  And, a U.S. Treasury 10-year note yield of sub-2% certainly adds interest to the dividends that can be earned from S&P 500® companies.  And, dividends may also provide a modest potential hedge against changes in nominal GDP growth, should the economy decelerate unexpectedly.

The principal drivers of dividends are corporate profit growth and payout ratios.  From an economic perspective, the amount of dividends market participants should expect for the whole economy may be defined by the following formula:

Aggregate Dividends = (Nominal GDP) x (Corporate Earnings as % of GDP) x (Average Dividend Payout Ratio)

That is, aggregate dividends can be determined arithmetically by nominal GDP, corporate earnings as a percent of nominal GDP, and the average dividend payout ratio.

Moreover, dividends are a key component of one of the most venerable means of valuing equity markets  — the dividend discount model, which holds that equity valuations are (or should be) equal to the discounted value of future dividends.

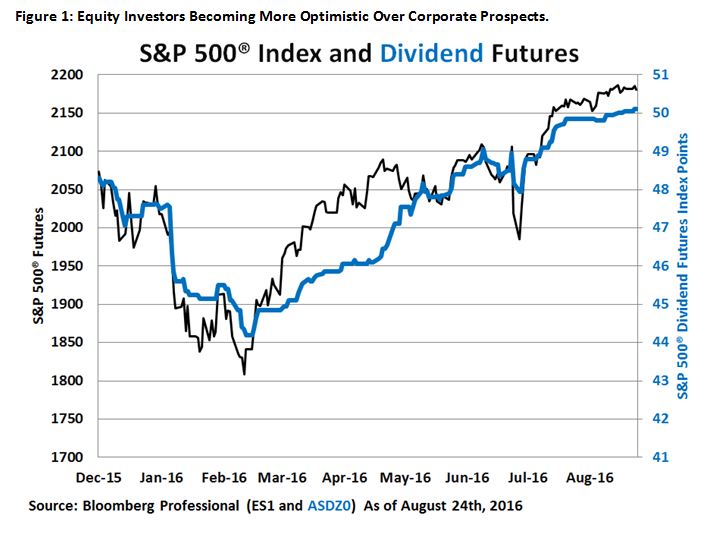
Currently markets are pricing slow growth for dividends.  The December 2020 futures price for S&P 500® dividends points to 50.1 index points versus 45.6 for December 2016.  This implies a modest 2.2% annualized growth rate over the last four years of this decade.  Nominal GDP might expand a little faster than that, perhaps at around 3.5% or 4% per year, assuming 1.5% to 2.0% real growth and a similar level of inflation.  In turn, this implies that corporate earnings, from which dividends are paid out, will likely grow more slowly than nominal GDP.

Market participants have been revising their views on dividends and are becoming much more optimistic.  Since February, pricing for 2020 dividends has risen from 44.35 index points to 50.1 — a 12% increase.  This increase comes on the back of a 20% rise in the S&P 500® index as equity investors become more optimistic about prospects for firms in general (Figure 1).

Capture

We are living in a slow growth world, however, and the rather modest expectations for dividend growth reflect that.

All examples in this report are hypothetical interpretations of situations and are used for explanation purposes only. The views in this report reflect solely those of the author and not necessarily those of CME Group or its affiliated institutions. This report and the information herein should not be considered investment advice or the results of actual market experience.
S&P Dow Jones Indices is an independent third party provider of investable indices.  We do not sponsor, endorse, sell or promote any investment fund or other vehicle that is offered by third parties. The views and opinions of any third party contributor are his/her own and may not necessarily represent the views or opinions of S&P Dow Jones Indices or any of its affiliates.

The posts on this blog are opinions, not advice. Please read our Disclaimers.

Japanese Market Participants Accessing U.S. Treasuries (Part 2)

Contributor Image
Michele Leung

Former Director, Fixed Income Indices

S&P Dow Jones Indices

Japanese market participants looking to access U.S. Treasury bonds or any other international bond market may need to be aware of fixed income risk and currency volatility.  Depending on their investment view, Japanese market participants may choose to hedge currency risk or remain unhedged. Either way, market participants may be exposed to additional returns or a reduction in returns that can result from the hedging or the performance of the foreign currency.

To illustrate this, let’s look at the S&P U.S. Treasury Bond 7-10 Year Index (TTM JPY) and the S&P U.S. Treasury Bond 7-10 Year Index (TTM JPY Hedged). The S&P U.S. Treasury Bond 7-10 Year Index (TTM JPY) measures the performance of U.S. Treasury bonds maturing in 7 to 10 years and is calculated in Japanese yen, while the S&P U.S. Treasury Bond 7-10 Year Index (TTM JPY Hedged) measures the performance of U.S. Treasury bonds hedged in Japanese yen.

As observed in Exhibit 1, the historical total return of the S&P U.S. Treasury Bond 7-10 Year Index (TTM JPY Hedged) closely tracked the S&P U.S. Treasury Bond 7-10 Year Index, which is calculated in USD. The total return of the hedged index is composed of the local total return and the hedging return, which is derived from the forward return and depends on the interest rate differential between the countries. Since the S&P U.S. Treasury Bond 7-10 Year Index (TTM JPY) has exposure to currency fluctuation, it resulted in higher volatility, and it outperformed or underperformed the hedged index depending on the time horizon.

Exhibit 1: Comparison of S&P U.S. Treasury Bond 7-10 Year Indices’ Returns20180824a

The reduced volatility of the S&P U.S. Treasury Bond 7-10 Year Index (TTM JPY Hedged) is further demonstrated in Exhibit 2; the volatility of the hedged index was approximately half that of the unhedged version over the one-, three-, and five-year periods.  In other words, historical data suggests that the S&P U.S. Treasury Bond 7-10 Year Index (TTM JPY Hedged) has a better risk-adjusted return profile.20180824b

Conclusion

The S&P U.S. Treasury Bond 7-10 Year Index (TTM JPY Hedged) and the S&P U.S. Treasury Bond 7-10 Year Index (TTM JPY) seek to track intermediate-term U.S. Treasury bonds while giving market participants the option to have currency exposure or manage their currency risk.  Japanese market participants seeking the benefits of diversification can access U.S. Treasury bonds.  The portfolio volatility could be further reduced by currency hedging, which historically has resulted in a better risk-adjusted return profile.

The posts on this blog are opinions, not advice. Please read our Disclaimers.

Japanese Market Participants Accessing U.S. Treasuries (Part 1)

Contributor Image
Michele Leung

Former Director, Fixed Income Indices

S&P Dow Jones Indices

Since the negative interest rate policy was announced by the Bank of Japan, the yield of the S&P Japan Sovereign Bond Index has tightened 33 bps to -0.07%, as of Aug. 23, 2016.  As the quantitative and qualitative easing program continues, some Japanese market participants seek investments that diversify their portfolios.  U.S. treasury bonds have become appealing, as they offer better yields and high creditworthiness.

Fixed income investments can play an important role in a well-diversified portfolio, as they tend to reduce the overall portfolio volatility and generate income.  Historically, U.S. bonds and U.S. equities have performed differently; they have negative correlations over the five-year period ending Aug. 23, 2016.[1]

The benefit of diversification still holds when looking into Japanese yen assets.  In the correlation analysis in Exhibits 1 and 2, the Japanese equities market is represented by the S&P Japan 500 (TR), the U.S. equities market is represented by the S&P 500 JPY Hedged (TR), and the Japanese sovereign bond market is represented by the S&P Japan Sovereign Bond Index.  These assets are separately compared against the S&P U.S. Treasury Bond 7-10 Year Index (TTM JPY), which is calculated in Japanese yen, and the S&P U.S. Treasury Bond 7-10 Year Index (TTM JPY Hedged), which tracks the same bonds with returns represented in Japanese yen but is hedged in an effort to eliminate currency exposure through a one-month forward currency contract.

Regardless of market participants’ option to hedge the currency or not, historical data shows that U.S. Treasury bonds have had low to negative correlations with other major asset classes offered in Japan. Hence, there is a potential diversification benefit.

Exhibit 1: Correlation With the S&P U.S. Treasury Bond 7-10 Year Index (TTM JPY)

20160823a

Exhibit 2: Correlation With the S&P U.S. Treasury Bond 7-10 Year Index (TTM JPY Hedged)

20180823b

[1]   Based on return performance of the S&P 500® (TR) and the S&P U.S. Treasury Bond 7-10 Year Index; data as of Aug. 23, 2016.


The posts on this blog are opinions, not advice. Please read our Disclaimers.

Lessons From Canada’s Top Pension Managers

Contributor Image
Adam Butler

CEO

ReSolve Asset Management

Summary
Many studies have documented the fact that market participants in many regions, including Canada, invest more in the companies from their home country than would be warranted by their country’s share of global markets.  Three of Canada’s largest and most sophisticated pension funds have cut Canadian exposure in their equity allocations.  Yet private Canadian market participants have so far failed to follow suit.  Private market participants’ Canadian equity holdings represent almost 18 times Canada’s share of world markets.

Large, Sophisticated Managers Are Reducing Canadian Equity Exposure.
Canada has several world-class pension plan managers.  The Canada Pension Plan Investment Board, the Ontario Teachers’ Pension Plan, and the Caisse de depot et de placements du Quebec collectively manage CAD 700 billion.  Each has over 1,000 employees with offices in financial centers around the globe.

It’s worth exploring the holdings of these large, sophisticated fund managers to compare and contrast with your other portfolios.  Of particular note, all three pension managers have materially cut their portfolio allocations to publicly traded Canadian equities in the past three years.  The Ontario Teachers’ Pension Plan has lead the way, reducing its Canadian equity exposure to 1.6% in fiscal 2015 from 9.0% in 2012.  The Canada Pension Plan cut its Canadian equity holdings to 5.4% from 8.4%, and the Caisse de Depot’s allocation fell from 12.6% to 9.0%.

Capture

Private Canadian Investors Heavily Overweight Canada
In contrast to Canadian institutions, Canadian private market participants tend to heavily overweight the local market.  A 2016 Vanguard study calculated that Canadians held 59% of their equity investments in Canada.

These figures are about 18 times more than Canada’s share of the world equity markets.  For example, according to the S&P Global 1200, as of June 30, 2016, Canadian stocks accounted for 3.3% of global equity market capitalization.

“Home country” bias is a common theme in behavioral economics literature about investing, but a multiple of 18 seems excessive.  It means that most market participants are making an active “bet” that the commodity-driven Canadian market will outperform all other global markets and asset classes by a substantial margin.  This view appears to stand in contrast to the views expressed by some of Canada’s most respected institutions.

Conclusion: Time to Think Globally
Canada’s most sophisticated institutions have moved to take advantage of global opportunities in their equity allocations.  Individual Canadian market participants might benefit from a similar line of thinking.

[1] Canada Pension Plan annual reports for March 2016 and 2013.
[2] Ontario Teachers’ Pension Plan annual reports for December 2015 and 2012.  Calculation of percentages by ReSolve Asset Management.
[3] Caisse de depot et placement du Quebec 2015 annual reports for December 2015 and 2012.

The posts on this blog are opinions, not advice. Please read our Disclaimers.

Oil's Price Rise Boosts All Equity Sectors, But One

Contributor Image
Jodie Gunzberg

Former Managing Director, Head of U.S. Equities

S&P Dow Jones Indices

The S&P GSCI Crude Oil Total Return is up 15.2%, its biggest six day gain, ending Aug. 18, 2016, since the six day gain of 16.1%, ending on Apr. 13, 2016.  As both the IMF (International Monetary Fund) and IEA (International Energy Agency) consider the oil price as a major input to global GDP estimates, and the IMF states the oil price assumptions used for the current World Economic Oulook Update (WEO) are about $10 higher for 2016 and 2017 than those used for the April 2016 WEO, one may consider evaluating the impact of an oil price increase on equity sectors since equities are the biggest holding for many investors.

Using monthly index data from Dec. 1998 for S&P 500 Sectors and oil, and also data from Aug. 2006 for S&P 500 Bond Sectors, some conclusions can be drawn about the sector sensitivity to oil and sentiment in sectors.

Source: S&P Dow Jones Indices. As of Jul. 29, 2016.

Interestingly, but perhaps not surprisingly, when oil rises, it helps all equity sectors except Telecom.  In the table below, for every 1% increase in oil, the telecom sector loses 2 tenths basis points. It’s not much but it is the only losing sector.

Source: S&P Dow Jones Indices.

Telecom may suffer with rising oil prices since gasoline and automobile demand may decrease that slows integration of connectivity in cars. It also may slow growth in digital technologies that make it easier to access and pay for public services using mobile devices, such as parking and transportation.  Also, investors are feeling most pessimistic about telecom since Dec. 2014, based on the excess return of bonds over stocks in the sector.  Back then, the index lost 10.8% through Sep. 2015, so it is possible this could indicate another drop.

Source: S&P Dow Jones Indices

Putting aside energy and materials that clearly rise from an oil increase, technology gains most from an oil increase, rising on average nearly 22 basis points for every 1% gain in oil. Energy companies have increased efficiency tremendously over the past few years by investing in new technology, so as oil rises, it makes sense that energy boosts the tech sector. However, while investors are still willing to take some risk in the upside of the tech sector right now, the pessimism in tech (rapidly declining risk premium) has peaked this month the most of any sector, reflecting a shift away from the sector, despite the oil gain, and that is a warning signal.

Source: S&P Dow Jones Indices

One must consider the fear in tech for the broader implications on the stock market, given technology is the digital backbone of the economy and the mood is getting gloomy. This is since tech is one of the most highly correlated (0.83) sectors to the S&P 500 and the S&P 500 captures much (52%) of tech’s losses.

The falling dollar may help oil further if the fed doesn’t raise rates. It gains about 4.3% for every 1% US dollar drop that should translate into almost at 1% gain for tech. However in the past week the dollar fell near 1.5%  but tech has only gained about 25 basis points in this oil rally of more than 15%, which reflects potential economic weakness.

More than a 5% discount in S&P 500 bond over stock performance and some persistence historically indicates a true downturn in the overall stock market. There have only been 3 consecutive discounts one time since 2011 and that was in Q1 2016. Now there is still a slight premium but it is dropping quickly, so it doesn’t feel like a crisis but it’s jittery.

Source: S&P Dow Jones Indices

Our 10th Annual Commodities Seminar takes place in London on 29th September. Additional information and registration are available online now. #SPDJICommods

The posts on this blog are opinions, not advice. Please read our Disclaimers.