Get Indexology® Blog updates via email.

In This List

Lessons From Canada’s Top Pension Managers

Oil's Price Rise Boosts All Equity Sectors, But One

The VIX is Low, But Should You Fasten Your Seatbelt?

The CBLO Rate: Its Movements, Effects, and Future

Performance Trends in the U.K. Gilt and Corporate Bond Markets

Lessons From Canada’s Top Pension Managers

Contributor Image
Adam Butler

CEO

ReSolve Asset Management

Summary
Many studies have documented the fact that market participants in many regions, including Canada, invest more in the companies from their home country than would be warranted by their country’s share of global markets.  Three of Canada’s largest and most sophisticated pension funds have cut Canadian exposure in their equity allocations.  Yet private Canadian market participants have so far failed to follow suit.  Private market participants’ Canadian equity holdings represent almost 18 times Canada’s share of world markets.

Large, Sophisticated Managers Are Reducing Canadian Equity Exposure.
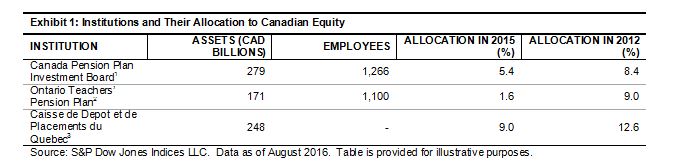
Canada has several world-class pension plan managers.  The Canada Pension Plan Investment Board, the Ontario Teachers’ Pension Plan, and the Caisse de depot et de placements du Quebec collectively manage CAD 700 billion.  Each has over 1,000 employees with offices in financial centers around the globe.

It’s worth exploring the holdings of these large, sophisticated fund managers to compare and contrast with your other portfolios.  Of particular note, all three pension managers have materially cut their portfolio allocations to publicly traded Canadian equities in the past three years.  The Ontario Teachers’ Pension Plan has lead the way, reducing its Canadian equity exposure to 1.6% in fiscal 2015 from 9.0% in 2012.  The Canada Pension Plan cut its Canadian equity holdings to 5.4% from 8.4%, and the Caisse de Depot’s allocation fell from 12.6% to 9.0%.

Capture

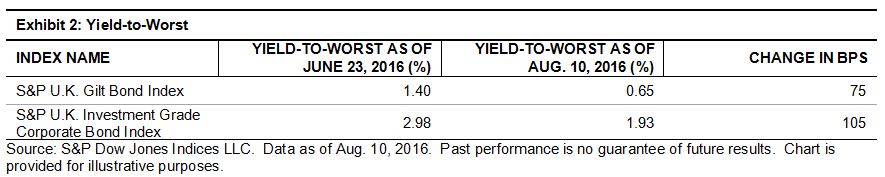
Private Canadian Investors Heavily Overweight Canada
In contrast to Canadian institutions, Canadian private market participants tend to heavily overweight the local market.  A 2016 Vanguard study calculated that Canadians held 59% of their equity investments in Canada.

These figures are about 18 times more than Canada’s share of the world equity markets.  For example, according to the S&P Global 1200, as of June 30, 2016, Canadian stocks accounted for 3.3% of global equity market capitalization.

“Home country” bias is a common theme in behavioral economics literature about investing, but a multiple of 18 seems excessive.  It means that most market participants are making an active “bet” that the commodity-driven Canadian market will outperform all other global markets and asset classes by a substantial margin.  This view appears to stand in contrast to the views expressed by some of Canada’s most respected institutions.

Conclusion: Time to Think Globally
Canada’s most sophisticated institutions have moved to take advantage of global opportunities in their equity allocations.  Individual Canadian market participants might benefit from a similar line of thinking.

[1] Canada Pension Plan annual reports for March 2016 and 2013.
[2] Ontario Teachers’ Pension Plan annual reports for December 2015 and 2012.  Calculation of percentages by ReSolve Asset Management.
[3] Caisse de depot et placement du Quebec 2015 annual reports for December 2015 and 2012.

The posts on this blog are opinions, not advice. Please read our Disclaimers.

Oil's Price Rise Boosts All Equity Sectors, But One

Contributor Image
Jodie Gunzberg

Former Managing Director, Head of U.S. Equities

S&P Dow Jones Indices

The S&P GSCI Crude Oil Total Return is up 15.2%, its biggest six day gain, ending Aug. 18, 2016, since the six day gain of 16.1%, ending on Apr. 13, 2016.  As both the IMF (International Monetary Fund) and IEA (International Energy Agency) consider the oil price as a major input to global GDP estimates, and the IMF states the oil price assumptions used for the current World Economic Oulook Update (WEO) are about $10 higher for 2016 and 2017 than those used for the April 2016 WEO, one may consider evaluating the impact of an oil price increase on equity sectors since equities are the biggest holding for many investors.

Using monthly index data from Dec. 1998 for S&P 500 Sectors and oil, and also data from Aug. 2006 for S&P 500 Bond Sectors, some conclusions can be drawn about the sector sensitivity to oil and sentiment in sectors.

Source: S&P Dow Jones Indices. As of Jul. 29, 2016.

Interestingly, but perhaps not surprisingly, when oil rises, it helps all equity sectors except Telecom.  In the table below, for every 1% increase in oil, the telecom sector loses 2 tenths basis points. It’s not much but it is the only losing sector.

Source: S&P Dow Jones Indices.

Telecom may suffer with rising oil prices since gasoline and automobile demand may decrease that slows integration of connectivity in cars. It also may slow growth in digital technologies that make it easier to access and pay for public services using mobile devices, such as parking and transportation.  Also, investors are feeling most pessimistic about telecom since Dec. 2014, based on the excess return of bonds over stocks in the sector.  Back then, the index lost 10.8% through Sep. 2015, so it is possible this could indicate another drop.

Source: S&P Dow Jones Indices

Putting aside energy and materials that clearly rise from an oil increase, technology gains most from an oil increase, rising on average nearly 22 basis points for every 1% gain in oil. Energy companies have increased efficiency tremendously over the past few years by investing in new technology, so as oil rises, it makes sense that energy boosts the tech sector. However, while investors are still willing to take some risk in the upside of the tech sector right now, the pessimism in tech (rapidly declining risk premium) has peaked this month the most of any sector, reflecting a shift away from the sector, despite the oil gain, and that is a warning signal.

Source: S&P Dow Jones Indices

One must consider the fear in tech for the broader implications on the stock market, given technology is the digital backbone of the economy and the mood is getting gloomy. This is since tech is one of the most highly correlated (0.83) sectors to the S&P 500 and the S&P 500 captures much (52%) of tech’s losses.

The falling dollar may help oil further if the fed doesn’t raise rates. It gains about 4.3% for every 1% US dollar drop that should translate into almost at 1% gain for tech. However in the past week the dollar fell near 1.5%  but tech has only gained about 25 basis points in this oil rally of more than 15%, which reflects potential economic weakness.

More than a 5% discount in S&P 500 bond over stock performance and some persistence historically indicates a true downturn in the overall stock market. There have only been 3 consecutive discounts one time since 2011 and that was in Q1 2016. Now there is still a slight premium but it is dropping quickly, so it doesn’t feel like a crisis but it’s jittery.

Source: S&P Dow Jones Indices

Our 10th Annual Commodities Seminar takes place in London on 29th September. Additional information and registration are available online now. #SPDJICommods

The posts on this blog are opinions, not advice. Please read our Disclaimers.

The VIX is Low, But Should You Fasten Your Seatbelt?

Contributor Image
Tim Edwards

Managing Director, Index Investment Strategy

S&P Dow Jones Indices

VIX has spent the whole of August below 14, and remains – at time of writing – close to its lowest levels in two years.  But the present calm may be dependent on a short-term seasonal effect; and we are approaching the traditional period where it ends.

August is traditionally a quiet month for U.S. equities.  The usual deluge of corporate announcements, elections, and product launches attenuates to a trickle, while traders and investors decamp to their holiday destinations.  Then, in September and throughout October, the world returns to business, sometimes only then announcing or processing events that may have occurred over the summer.

The lack of news flow in August and subsequent ramp-up creates a seasonal effect in volatility, with VIX depressed over the summer months and rising through late August and early September.

The graph below shows the historical extent of such seasonality, plotting the average level of VIX in comparison to its one year trailing average at each point in the year.  The effect is not dominated by one or two outlier events, but instead appears persistent; the grey shaded area shows a similar pattern for the 25% and 75% percentile range of values.  Today’s value is well below the historical interquartile range as VIX is 30% below its average level for the past year.

VIX Seasonality

Interestingly, there is a clear seasonal lull between late June and early August, and a significant increase towards the end of August.  The 35th week of the year showed, on average, the biggest rise in volatility.  Given that we are presently approaching the end of the 34th week of 2016, investors might wish to bear this history in mind.

The posts on this blog are opinions, not advice. Please read our Disclaimers.

The CBLO Rate: Its Movements, Effects, and Future

Contributor Image
Mahavir Kaswa

Former Associate Director, Product Management

S&P BSE Indices

In my blog “Introducing the CBLO Rate,” we discussed what the collateralized borrowing and lending obligations (CBLO) rate is and how the S&P BSE Liquid Rate Index would be useful for market participants.  In this post, let’s discuss the history of the CBLO rate and nature of CBLO rate movement.

The repo rate is the rate at which banks borrow from the Reserve Bank of India (RBI), and the reverse repo rate is the rate at which banks deposit their excess cash with the RBI; both are policy rates that move only when the RBI decides to change them during its periodic monetary policy review.  On the other hand, the CBLO rate is completely market driven and changes depending on the short-term liquidity situation in the market.

Generally, the CBLO rate should range between the repo and reverse repo rates, otherwise it would create an arbitrage opportunity for banks, which are active in both markets (repo and CBLO).  If the CBLO rate were to move out of the band of repo and reverse repo rates, banks could borrow from the cheaper market and lend in the more expensive market.  For example, if the CBLO rate is hovering around 5%, which is lower than the reverse repo rate of 6%, banks could  profit by borrowing at the CBLO rate and lending at the reverse repo rate (or depositing the same amount with the RBI), earning a risk-free profit of 1%.

Exhibit 1 illustrates the 30-day moving average CBLO rate, repo rate, and reverse repo rate.  The 30-day moving average is used to avoid outlier numbers and get a meaningful picture of all three rates.  From 2004 through the first half of 2009, it appears that the CBLO rate was more volatile and frequently outside of the repo rate and reverse repo rate band.  However, since 2010, the CBLO rate tended to be in between the repo rate and reverse repo rate, except during the second half of 2013 and first half of 2014.   Starting in November 2009, the RBI asked banks to set aside 5% of funds borrowed under the CBLO as a cash reserve ratio in order to stop discourage arbitrage opportunities between the two markets.

Exhibit 1: 30-Day Moving Average 

CBLO 1


While the CBLO market is gaining popularity among various money market instruments, at present it is only accessible to institutions such as banks, financial institutions, corporates, etc., and it is yet to become available for smaller investors.  Another problem with the CBLO is that the treasury manager has to roll over deposits every day unless he finds a borrower or a lender for the desired maturity in the CBLO market.  It is worth reiterating that the majority of liquidity is in overnight tenor, which means other tenor rates may have a liquidity premium as well.

One possible solution for this could be an ETF based on the S&P BSE Liquid Rate Index, an index that seeks to track the weighted-average CBLO rate.  An ETF fund manager would roll over the deposits each day to earn the daily overnight CBLO rate.  This would also open the CBLO up to smaller investors as they buy ETFs to get exposure in the CBLO market.  This could effectively help increase liquidity in the CBLO market further.

While we have a liquid overnight CBLO market, it will be interesting to see how the term segment of the CBLO market evolves in the future.

The posts on this blog are opinions, not advice. Please read our Disclaimers.

Performance Trends in the U.K. Gilt and Corporate Bond Markets

Contributor Image
Heather Mcardle

Director, Fixed Income Indices

S&P Dow Jones Indices

On Aug. 4, 2016, the Bank of England cut its benchmark rate by 25 bps to a low of 0.25%.  This move, coupled with its announcement of a GBP 70 billion expansion of quantitative easing, with GBP 10 billion committed for the purchase of investment-grade corporate bonds, is furthering the positive performance of these asset classes.  Quantitative easing is an asset-buying program that is meant to keep rates low to stimulate the economy.

The S&P U.K. Gilt Bond Index had returned 16.93% YTD as of Aug. 10, 2016, while the S&P U.K. Investment Grade Corporate Bond Index came in at 17.32%.  Both of these asset classes continue to rally.  Since the vote for the Brexit on June 23, 2016, a rally based on flight to quality was largely expected for the U.K. gilt market, but the U.K. investment-grade corporate bond market has also has seen significant tightening of yields, despite concerns that a Brexit would negatively affect U.K. corporations.  Since the Brexit vote, the S&P U.K. Gilt Bond Index has tightened 75 bps and the S&P U.K. Investment Grade Corporate Bond Index has tightened 105 bps.

The question remains as to how much lower yields can go and how the Brexit will actually unfold.  Brexit impacts on the U.K. economy are starting to come in, with U.K. manufacturing output for Q2 2016 reversing its positive momentum and experiencing a sharp decline.

Capture

Capture

The posts on this blog are opinions, not advice. Please read our Disclaimers.