Get Indexology® Blog updates via email.

In This List

Rieger Report: Energy Sector Helps Drive Market

Asian Fixed Income: Indonesian Bonds Rally

Janet Yellen’s Message: Last Friday’s Employment Report Didn’t Change Much

Master Class Prep: The Transparency of Canadian Indices

A Possible Brexit, a Weak Pound, and an Outperforming U.K. Gilt Bond Market

Rieger Report: Energy Sector Helps Drive Market

Contributor Image
J.R. Rieger

Former Head of Fixed Income Indices

S&P Dow Jones Indices

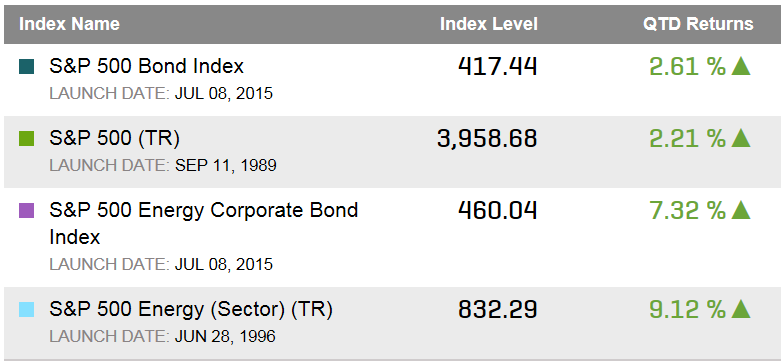
The recent oil price rally has pushed the energy sector upward in both the equity and bond markets. In the second quarter so far, the S&P 500 Energy Index (equity) has returned over 9.1% in total return and the S&P 500 Energy Corporate Bond Index has returned over 7.3%.  Meanwhile, the broader indices have seen more modest returns: the S&P 500 Bond Index (the debt of the S&P 500 companies) has returned 2.61% and the S&P 500 (TR) has returned 2.21%.

Table 1: Select indices and their quarter-to-date returns:

Source: S&P Dow Jones Indices, LLC. Data as of June 10, 2016. Table is provided for illustrative purposes. It is not possible to invest directly in an index. Past performance is no guarantee of future results.

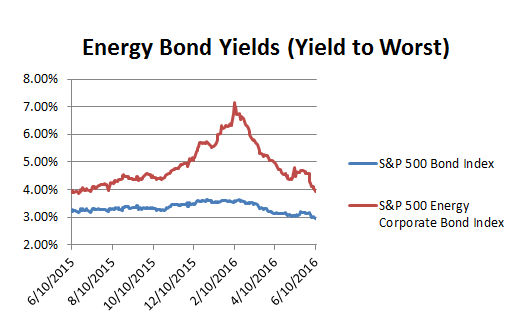
Yields of bonds in the S&P 500 Energy Corporate Bond Index have tumbled as bond prices have rallied.  At the end of March the average yield of bonds in the index was a 5.17%  and ended June 10th at a 3.95% –  a 122 basis point drop.  The average yields of bonds in the S&P 500 Bond Index have also fallen but only by 25 basis points during this time frame, helped in part by the inclusion of the energy bond sector.

Chart 1: Select indices and their yields (Yield to Worst):

Source: S&P Dow Jones Indices, LLC. Data as of June 10, 2016. Chart is provided for illustrative purposes. It is not possible to invest directly in an index. Past performance is no guarantee of future results.

The posts on this blog are opinions, not advice. Please read our Disclaimers.

Asian Fixed Income: Indonesian Bonds Rally

Contributor Image
Michele Leung

Former Director, Fixed Income Indices

S&P Dow Jones Indices

Despite hawkish FOMC minutes and a stronger U.S. dollar, Indonesian bonds rallied 10.15% year-to-date (YTD), outperforming the other nine countries tracked by the S&P Pan Asia Bond Index, data as of Jun 7, 2016.

The S&P Indonesia Bond Index tracks the performance of local currency denominated government and corporate bonds from Indonesia and with a total market value of IDR 1,511 trillion. The robust gain was boosted by the strong performance of sovereign bonds; the S&P Indonesia Sovereign Bond Index rose 10.78% in the same period. The index’s yield-to-maturity tightened 115 bps YTD to 7.73% , after reaching a 13-month low at 7.40% in mid-April 2016.

The S&P Indonesia Corporate Bond Index gained 7.36% YTD, while its yield-to-maturity tightened 125 bps to 9.07%. Across sector-level indices, the S&P Indonesia Utilities Bond Index outperformed the other sector indices and advanced 8.32%.

Standard & Poor’s Ratings Services recently revised its outlook on the long-term sovereign credit ratings on the Republic of Indonesia to ‘positive’ from ‘stable,’ while affirming the ‘BB+’ long-term and ‘B’ short-term sovereign credit ratings. The market expects more investors to access the Indonesian market if the speculation of rating upgrade becomes materialized, particularly for those who have not been holding Indonesia bonds for rating reasons.

Exhibit 1: The Yield-to-Maturity of the S&P Indonesia Corporate Bond Index and the S&P Indonesia Sovereign Bond Index

20160607


The posts on this blog are opinions, not advice. Please read our Disclaimers.

Janet Yellen’s Message: Last Friday’s Employment Report Didn’t Change Much

Contributor Image
David Blitzer

Former Managing Director and Chairman of the Index Committee

S&P Dow Jones Indices

Last Friday the markets were expecting to see May payrolls rise by something between 160,000 and 190,000 new jobs. Instead the report was an upsetting shocker with only 38,000 new jobs and a downward revision to the previous two months.  Stocks sold off at the opening, gold rose, talk of a fading expansion resumed and everyone agreed that there wouldn’t be a Fed rate hike this month.  Until Friday morning Fed watchers were expecting a last minute confirmation of a June rate hike from Janet Yellen in today’s speech.  After the bad news employment report analysts feared the weakness would limit the Fed’s ability to move rates higher until later in the year.

Speaking in Philadelphia today, Fed Chair Janet Yellen was clear that one nasty employment report doesn’t change the world or the economic outlook: “So the overall labor market situation has been quite positive. In that context this past Friday’s labor market report was disappointing.”  The Fed is making progress in meeting its mandate of 2% inflation and full employment:

  • Inflation is expected to move to 2% over the next couple of years. The sharp drop in oil prices and the strengthening of the dollar which were holding inflation down are reversing and these downward forces on prices are dissipating.
  • Friday’s report notwithstanding, the job market has improved throughout seven years of expansion. The unemployment rate has fallen, the job openings rate was a record high in March and the quit rate moved up. Weekly initial unemployment claims continue at very low levels.

Yellen’s economic outlook remains cautiously optimistic, even though there are a few clouds on the horizon but further progress is expected.

  • Further improvements in the labor markets and moderate GDP growth are foreseen. Rising equity and home prices have helped restore households’ wealth and the housing sector should see further gains. Housing is supported by low mortgage rates and consumer spending is helped by low gasoline prices.
  • “On the other hand” there are some less positive issues: China’s slowing growth, falling commodity prices and weak business fixed investment in the U.S.

There are four important uncertainties that could affect the economy and monetary policy:

  • The US expansion has been largely supported by domestic demand. The question is whether US moderate growth can continue without support from other economies, especially with the weak domestic investment performance.
  • Risks outside the US require attention as well. China’s growth is a concern although their currency has moved in a more predictable fashion recently. In the current environment of low interest rates and weak growth investors’ perception of risks can change quickly.  One unknown risk factor is the possibility that Britain will vote to leave the European Union.
  • US productivity has performed poorly in recent quarters and has not shown any signs of returning to stronger growth so far. This contributes to sluggish GDP growth and poor wage increases.
  • The inflation outlook is uncertain and dependent on expectations of future inflation. While oil prices are likely to recover and the labor market is improving, there are signs that expectations of future inflation are falling somewhat.

In the face of these uncertainties, Janet Yellen remains cautiously optimistic, describes monetary policy as stimulative with the Fed funds rate below its neutral level. Given all this, Yellen expects “further gradual increases in the federal funds rate will probably be appropriate to best promote the FOMC’s goals of maximum employment and price stability.”

The posts on this blog are opinions, not advice. Please read our Disclaimers.

Master Class Prep: The Transparency of Canadian Indices

Contributor Image
Kevin Horan

Former Director, Fixed Income Indices

S&P Dow Jones Indices

In anticipation of S&P Dow Jones Indices’ ETF Masterclass for Canadian Advisors on June 23, 2016: A Bright Future for Financial Advisory, it helps to revisit some of the company’s involvement in the country.  Our firm has always been committed to Canada, with an office on King Street West, and the company has always shown an eagerness to serve the country’s investment community.  Through the partnership with the Toronto Stock Exchange, the S&P/TSX Composite Index has been the headline index for the Canadian equity market since 1977.  In addition to equity performance measurement and design of strategic investing approaches, S&P DJI has provided Canadian market participants with products for other areas of investment.  The S&P/TSX Preferred Share Index launched on June 12, 2007 and is designed to measure the performance of Canadian preferred stock.

Recently, a Canadian fixed income family of indices was introduced, expanding S&P DJI’s product offerings.  The index series seeks track the entirety of Canada’s fixed income market by providing performance measurement tools that range from Treasury bills, benchmark sovereigns (through core fixed income products) to Canadian high-yield and real-return bonds.

The S&P Canada All Bond Index is a broad, market value weighted index that is designed to measure both high-yield and investment-grade bonds.  The index has been broken down into respective subindices (the S&P Canada Aggregate Bond Index and S&P Canada High Yield Corporate Bond Index) that match the different money management styles between the high-yield and investment-grade categories.  Within each of these indices, the segments of fixed income have been broken down further into subindices that measure the characteristics and performance of each respective fixed income product group.

Notably, the March 30, 2016 launch of an ETF product by Toronto Dominion Asset Management has added to the ability of investors to track the performance of the S&P Canada Aggregate Bond Index.

In upcoming blog posts, we’ll analyze more of the sovereign, provincial and municipal (quasi-government), corporate, and collateralized subindices in regard to total return performance, index characteristics, and issuer composition.

Exhibit 1: S&P Dow Jones Canadian Indices

Source: S&P Dow Jones Indices LLC. Data as of May 31, 2016. Table is provided for illustrative purposes.

If you would like to hear more on our Canadian fixed income indices, attend our upcoming event in Toronto on June 23, 2016.


The posts on this blog are opinions, not advice. Please read our Disclaimers.

A Possible Brexit, a Weak Pound, and an Outperforming U.K. Gilt Bond Market

Contributor Image
Heather Mcardle

Director, Fixed Income Indices

S&P Dow Jones Indices

Year-to-date, the U.K. gilt market has performed the best out of all of Europe’s safe-haven government bond markets.  The S&P U.K. Gilt Bond Index has returned 6.15% YTD, one of the highest in Europe.  Yields in U.K. gilts have tightened by 41 bps since the beginning of this year, with the S&P U.K. Gilt Bond Index yielding 1.36% as of June 1, 2016.  U.K. gilts are still seen as a safe haven despite concerns that the U.K. might elect to exit the European Union.  Concerns over a possible exit have put the pound near its seven-year lows versus the USD.  At the end of Q1 2016, GDP growth in the U.K. slowed to 0.4% from the 0.5% growth seen in the previous quarter, while annual growth was revised down to 2%.

Capture

U.K. polls offer no clear sign as to which direction the June 23, 2016 referendum will take.  Uncertainty often leads to a flight to safety, and the U.K. gilt market continues to be seen as a safe haven.  If a Brexit is voted for and uncertainty in the U.K. economy loom, U.K. gilts could benefit further (prices continue to rise and yields fall), as the Bank of England could keep rates low for longer.  Alternatively, if the British pound weakens significantly as a result of a Brexit, there could be a foreign capital flight out of the U.K.  This could cause a spike in inflation as import costs increase, thus encouraging bond yields to rise.

The posts on this blog are opinions, not advice. Please read our Disclaimers.