Get Indexology® Blog updates via email.

In This List

Rieger Report: Oil State Municipal Bonds - Risk or Opportunity

Rieger Report: Dogs of the Bond Market - Energy and Puerto Rico G.O.s

Making the Patient Sicker

Paper by Professor Bondarenko Has Intriguing New Analysis of PUT and WPUT Indexes

Factor Based Indices in India

Rieger Report: Oil State Municipal Bonds - Risk or Opportunity

Contributor Image
J.R. Rieger

Former Head of Fixed Income Indices

S&P Dow Jones Indices

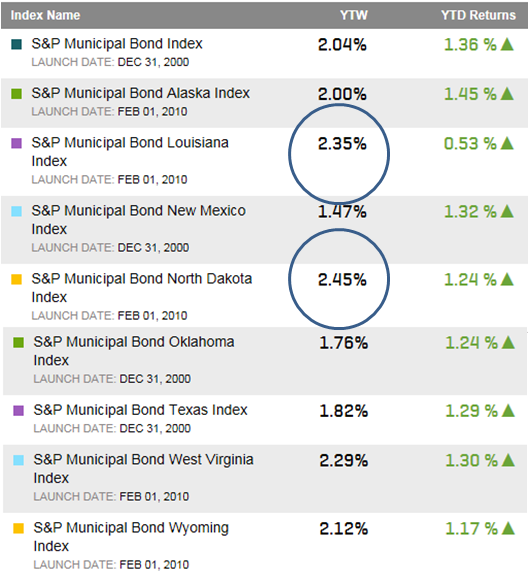
Local and state municipal bonds issued within states dependent on oil production are potentially in a cycle where they could underperform the overall bond market. So far, modestly higher yields can be seen in Louisiana and North Dakota and only Louisiana has underperformed to any significant degree year-to-date.  Supply and demand of the bonds themselves plays an important role here as some states do not issue bonds in large volumes or have state supported debt.

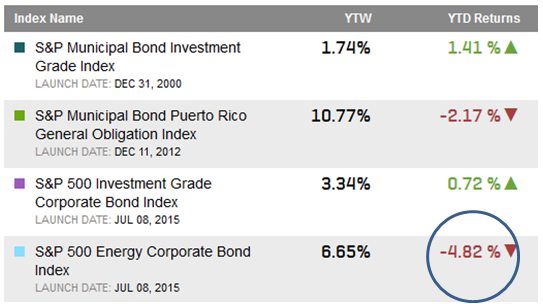
Table 1:  Select municipal bond indices, their yields and year-to-date returns

Source: S&P Dow Jones Indices.  Data as of February 22, 2016.
Source: S&P Dow Jones Indices. Data as of February 22, 2016.


The posts on this blog are opinions, not advice. Please read our Disclaimers.

Rieger Report: Dogs of the Bond Market - Energy and Puerto Rico G.O.s

Contributor Image
J.R. Rieger

Former Head of Fixed Income Indices

S&P Dow Jones Indices

Energy and Puerto Rico remain the sectors to watch as they continue to be drags on the bond markets.

Energy making this sector the lead ‘dog’ in performance so far in 2016. The S&P 500 Energy Corporate Bond Index is down over 4.8% year-to-date causing significant damage to the corporate bond markets as the index tracks over $289billion in par amount of bonds.

Table 1: Select bond indices, their yields and returns (YTD)

Source: S&P Dow Jones Indices LLC. Data as of February 19, 2016.

Puerto Rico municipal bonds have enjoyed a positive bounce in 2016 however the general obligation bonds are still a small anchor on performance of the high yield municipal bond market as the S&P Municipal Bond Puerto Rico General Obligation Index is down over 2% year-to-date.  This segment is a small anchor as the index tracks just over $11billion in par amount of general obligation bonds.

The posts on this blog are opinions, not advice. Please read our Disclaimers.

Making the Patient Sicker

Contributor Image
Craig Lazzara

Former Managing Director, Index Investment Strategy

S&P Dow Jones Indices

Years ago, I saw a cartoon picturing two Victorian-era doctors discussing a patient.  “What did you prescribe for Jones’ rheumatism?” asked the first; the second answered “A cold bath and a brisk walk every morning.”  “Good God, man, that will give him pneumonia!” said the first.  “I know,” replied the second doctor, “I made my reputation curing that.”

Somehow I was reminded of this exchange when I learned from this morning’s news that some institutional investors, smarting from recent losses, are considering increasing their commitment to active equity management.  Their operating assumption seems to be that active managers will do a better job of capital preservation in a challenging and volatile market.

There’s certainly some plausibility to this argument.  It turns out, however, to be another beautiful theory mugged by a gang of facts.  The facts come from our periodic SPIVA reports, which compare the results of actively-managed mutual funds against passive benchmarks.  Weak markets, it turns out, are no panacea for active managers.  In 2008, e.g., 54% of large-cap U.S. funds underperformed the S&P 500.  Results were even worse for mid- and small-cap managers (75% and 84% underperformers, respectively).

Statistics say, in other words, that moving from passive to active as a way of managing market volatility is likely to make performance worse, not better.  Fortunately for anxious investors, passive strategies which focus on the lowest volatility segment of the equity market are most likely to outperform precisely when the market is weakest.  Consider, for example, the S&P 500 Low Volatility Index and its cousin, the S&P 500 Low Volatility High Dividend Index:

LV and baby LV to 021816

Both of these indices are designed to attenuate the returns of the S&P 500 in both directions; historically they have both tended to underperform market rallies but outperform when markets are weak.  Their reliability as defensive vehicles has far exceeded that of active management.  Investors concerned about continuing volatility and market weakness should consider indicizing their defensive strategies.


The posts on this blog are opinions, not advice. Please read our Disclaimers.

Paper by Professor Bondarenko Has Intriguing New Analysis of PUT and WPUT Indexes

Contributor Image
Matt Moran

Head of Index Insights

Cboe Global Markets

Jan. 27, 2016 – A new 10-page study examines both the CBOE S&P 500 PutWrite Index (PUT) and the CBOE S&P 500 One-Week PutWrite Index (WPUT), comparing their performances with that of traditional benchmark stock and bond indexes. This is the first comprehensive published study that examines the performance of a benchmark strategy index that incorporates Weeklys options. Written by Oleg Bondarenko, professor of finance at the University of Illinois at Chicago, the study — “An Analysis of Index Option Writing with Monthly and Weekly Rollover”– analyzes the performance of the two indexes through the end of 2015.

The new paper discusses 19 Exhibits. In this Blog I highlight 5 of the Exhibits.

1. HIGHER AGGREGATE GROSS PREMIUMS USING S&P 500® WEEKLYS OPTIONS

CBOE introduced Weeklys options in 2005. In the initial years of Weeklys trading, it appeared to me that some observers thought that Weeklys might be used primarily by retail speculators, but in recent years I have heard from multiple institutional investors that they are writing S&P 500 Weeklys options for the purposes of prudent income enhancement. The new study found that, from 2006 to 2015, the average annual gross premium collected was 24.1 percent for the PUT Index and 39.3 percent for the WPUT Index. While a one-time premium collected by the weekly WPUT Index usually was smaller than a premium collected by the monthly PUT Index, the WPUT Index had higher aggregate annual premiums because: (1) premiums were collected 52 times, rather than 12 times, per year, and (2) time decay (or theta) usually works in favor of the WPUT Index vs. the PUT Index.

1 - Premiums PUT WPUT
2. PUT INDEX HAD HIGHEST RETURNS SINCE MID-1986

In the period from mid-1986 through the end of 2015 –

  • (1) The total % growth for benchmark indexes was 1622% for the PUT Index, 1499% for the S&P 500 Index, and 646% for the Citigroup 30-year Treasury Bond Index; (all of the indexes (except the VIX® Index) in this Blog are total return indexes), and
  • (2) The annual compound return of the PUT Index was 10.13 percent, compared with 9.85 percent for the S&P 500 Index.

2 - long-tern line PUT

3. DRAWDOWNS WERE LESS SEVERE FOR PUT AND WPUT INDEXES (COMPARED TO S&P 500)

From 2006 through 2015, the worst drawdowns were down 24.2 percent for WPUT, down 32.7 percent for PUT and down 50.9 percent for the S&P 500.

3 - Drawdown PUT WPUT
4. HIGHER RISK-ADJUSTED RETURNS FOR PUT INDEX

Over a period of 29½ years, the PUT Index had higher risk-adjusted returns (as measured by the Sharpe Ratio, Sortino Ratio, and Stutzer Index) than the S&P 500, Russell 2000, MSCI World, and Citigroup 30-Year Treasury Bond Indexes. However, please note that many risk-adjusted return metrics assume a normal distribution with no skewness, but there was negative skewness for several indexes, including PUT (-2.09), S&P 500 (-0.79), and Russell 2000 (-0.89).

4 - Sharpe Sortino

5. SOURCE OF RETURNS – RICHLY PRICED SPX OPTIONS

An inquiring investor might ask – how could the PUT Index have higher returns and lower volatility over a period of almost three decades? A key source of returns for sellers of SPX index options has been the fact that, according to Exhibit 5, these options have been richly priced in all the years since 1990 (except in 2008).

5 - Rich Pricing

MORE INFORMATION

For links to the new paper and to several other options-based strategy papers, and to data and information on the PUT and WPUT indexes, please visit www.cboe.com/benchmarks.

The posts on this blog are opinions, not advice. Please read our Disclaimers.

Factor Based Indices in India

Contributor Image
Utkarsh Agrawal

Associate Director, Global Research & Design

S&P Dow Jones Indices

The recent turmoil in the Chinese market has taken the global market on a turbulent ride since the beginning of 2016. India was no exception. During the first two weeks of 2016, the S&P BSE SENSEX lost almost 6.37%, making some investors jittery. Foreign investors took out almost INR 34.84 billion from the Indian stock market, while mutual funds added close to INR 28.18 over the same time period. While the broader stock market suffered a huge draw down through January 15, 2016, let’s see how a new series of factor based indices that were recently launched by Asia Index Private Limited fared over the same time frame based on back-tested data.

A high-level summary of the characteristics of these indices is as follows.

  • All four of the factor based indices include 30 stocks from the S&P BSE LargeMidCap. The constituents differ depending on the rules of the index.
  • The S&P BSE LargeMidCap is a size sub-index of S&P BSE AllCap. Its methodology is designed to cover approximately 85% of the total market cap of the S&P BSE AllCap and is a float-market-weighted index.
  • The S&P BSE Enhanced Value Index consists of “best value” stocks according to a proprietary methodology. “Value” is measured using the price-to-book, price-to-earnings, and price-to-sales ratios of companies.
  • The S&P BSE Low Volatility Index consists of the least-volatile stocks measured over a one-year period.
  • The S&P BSE Momentum Index consists of the stocks within the S&P BSE LargeMidCap with the highest momentum measured over a one-year period. Momentum is measured as risk-adjusted price performance over time.
  • The S&P BSE Quality Index consists of the “highest quality” stocks according to a proprietary methodology. Quality is measured using the return-on-equity, financial leverage, and accrual ratios of companies.

Over the past two years ending Jan. 15, 2016, the S&P BSE Quality Index had a cumulative total return of 55.46%, which was the highest among the four factor indices (see Exhibit 1). It was followed by the S&P BSE Low Volatility Index, which had a cumulative total return of 52.58%. Over the same period, the S&P BSE Enhanced Value Index performed lower than the S&P BSE LargeMidCap. While the S&P BSE Quality Index and the S&P BSE Low Volatility Index displayed lower volatility in comparison with the S&P BSE LargeMidCap (see Exhibit 2), the S&P BSE Enhanced Value Index was 80% more volatile than the S&P BSE LargeMidCap over the same two-year period.

Over the past one-year period ending Jan. 15, 2016, the S&P BSE Low Volatility Index, the S&P BSE Momentum Index, and the S&P BSE Quality Index were in the black, even though the S&P BSE LargeMidCap ended in the red (see Exhibit 1). The S&P BSE Low Volatility Index and the S&P BSE Quality Index even displayed lower volatility than the S&P BSE LargeMidCap (see Exhibit 2). Over the same period, the S&P BSE Enhanced Value Index lost 24%, which was more than two-times the decline suffered by the S&P BSE LargeMidCap (see Exhibit 1).

During the six-month period ending Jan. 15, 2016, all of the indices delivered negative performance (see Exhibit 1). The S&P BSE Enhanced Value Index remained the most volatile and suffered the largest decline of the four of the factor based indices (see Exhibit 2).

Overall, the markets have been in the bear mode, and we can notice that factor based indices displayed their own risk/return characteristics.

Ex - Cumlative Returns


Ex - Annualized Volatility


The posts on this blog are opinions, not advice. Please read our Disclaimers.