Much has been written about dividends in academic literature. There are several theories regarding the dividend policies of companies. One theory asserts that dividends are irrelevant because an investor who wants cash flows could sell shares. Another theory suggests that a bird in the hand is worth two in the bush, meaning that investors prefer cash dividends over uncertain capital gains. There are other arguments that take into account the tax treatment, in which investors would prefer dividends to capital gains if dividends were taxed favorably. In India, dividends are non-taxable in the hands of the recipient. As mentioned in a prequel to this article, India has historically had a lower dividend yield in comparison with developed nations. Moreover, Indian large- and mid-cap companies have exhibited more stable dividend yields in comparison with small-cap companies. Let’s take a closer look at the large-cap segment of the Indian market.
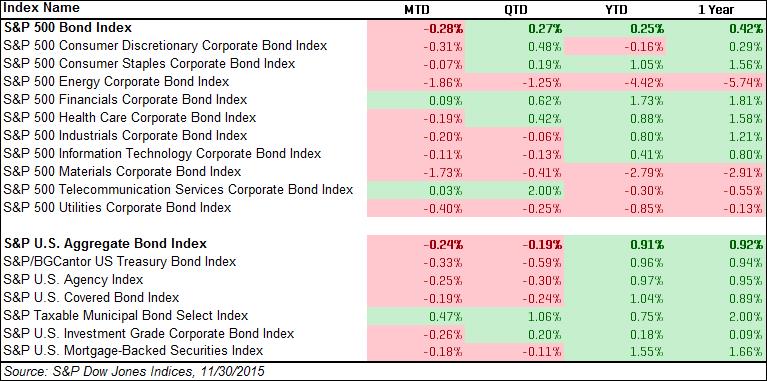
From Exhibit 1, we can see that the majority of Indian companies in the S&P BSE LargeCap have paid dividends between 2005 and 2015. The S&P BSE LargeCap is designed to measure the top 70% of companies in the S&P BSE AllCap, based on the cumulative average daily total market capitalization of the included companies over a one-year period. In general, companies prefer not to reduce or omit dividends, as it is perceived negatively in the capital market. This has been noted in the past when the aggregate dividend paid by the companies in S&P BSE LargeCap has either increased or remained the same. This occurred even during the 2008 global financial crisis, although the number of non-dividend-paying companies also slightly increased during this period. More recently, during fiscal year 2015, the aggregate dividends paid have decreased in the S&P BSE LargeCap.
Exhibit 1: Dividend-Paying History of Companies in S&P BSE LargeCap
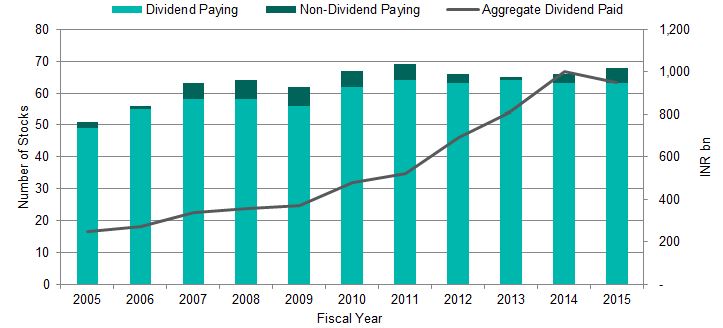
Source: S&P Dow Jones Indices LLC, Factset. Data as of Aug. 31, 2015. Past performance is no guarantee of future results. Chart is provided for illustrative purposes.
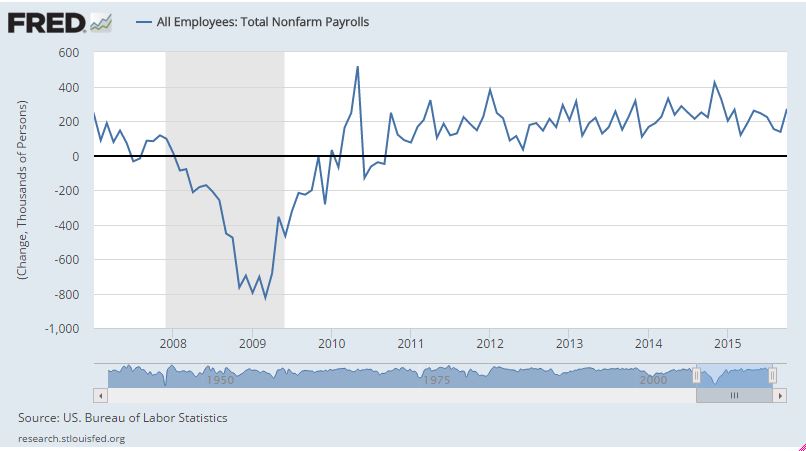
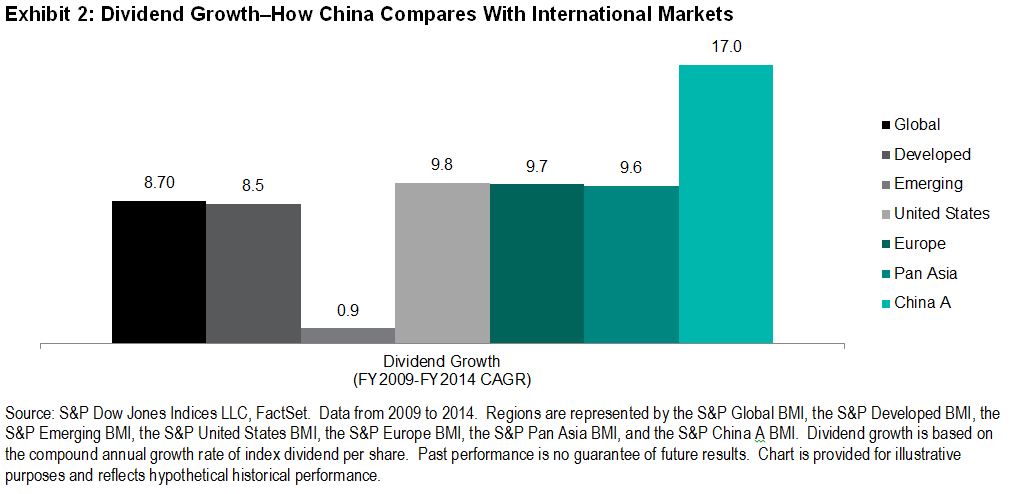
From Exhibit 2, it can be observed that the majority of the dividend-paying companies in the S&P BSE LargeCap have had a dividend payout ratio (DPR) range of 0%-40% in the 10-year period ending in 2015. More recently, the percentage of dividend-paying companies with a DPR greater than 40% has increased. Companies have negative earnings when DPR is less than 0%, and if it is greater than 100%, then companies have paid out more than they have earned in that fiscal year. In addition, we can note that there were few companies in the S&P BSE LargeCap with a DPR of either less than 0% or greater than 100%.
Exhibit 2: DPR History of Dividend-Paying Companies in the S&P BSE LargeCap
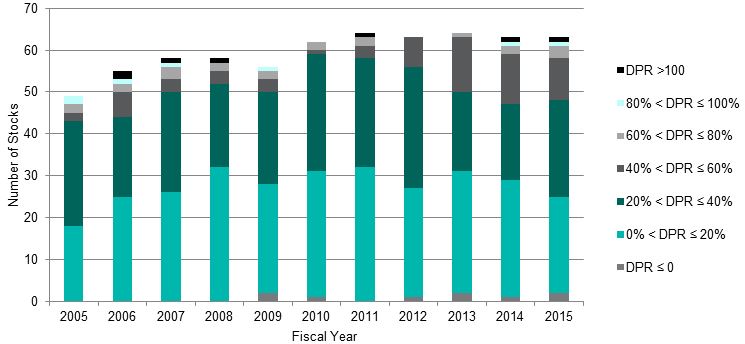
Source: S&P Dow Jones Indices LLC, Factset. Data as of Aug. 31, 2015. Past performance is no guarantee of future results. Chart is provided for illustrative purposes.
Different classes of investors have different preferences for dividend income. Some may prefer companies that have paid stable or increasing dividends over those that either do not pay dividends or have an unstable dividend payment history. However, dividend increases do attract attention in the capital markets. Together with S&P Dow Jones Indices, Asia Index Private Limited recently launched the S&P BSE Dividend Stability Index. It is designed to measure the performance of companies in the S&P BSE LargeCap that have paid ordinary dividends of 4% or more for at least seven of the past nine years, and the most recent DPR should be between 0% and 100%.
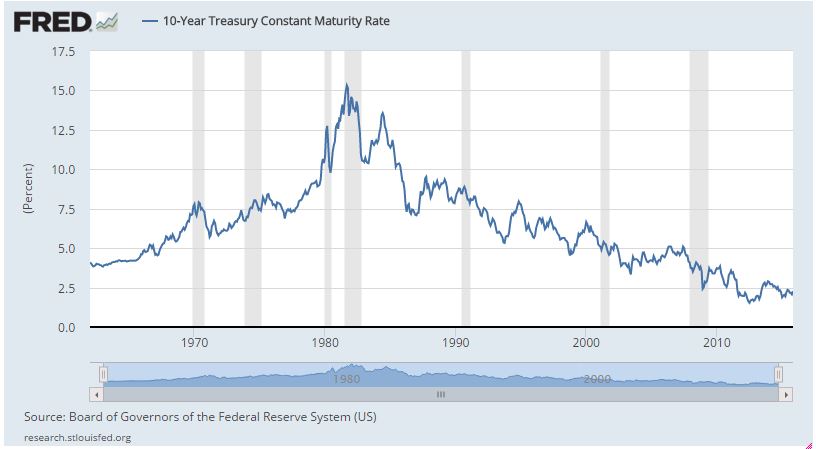
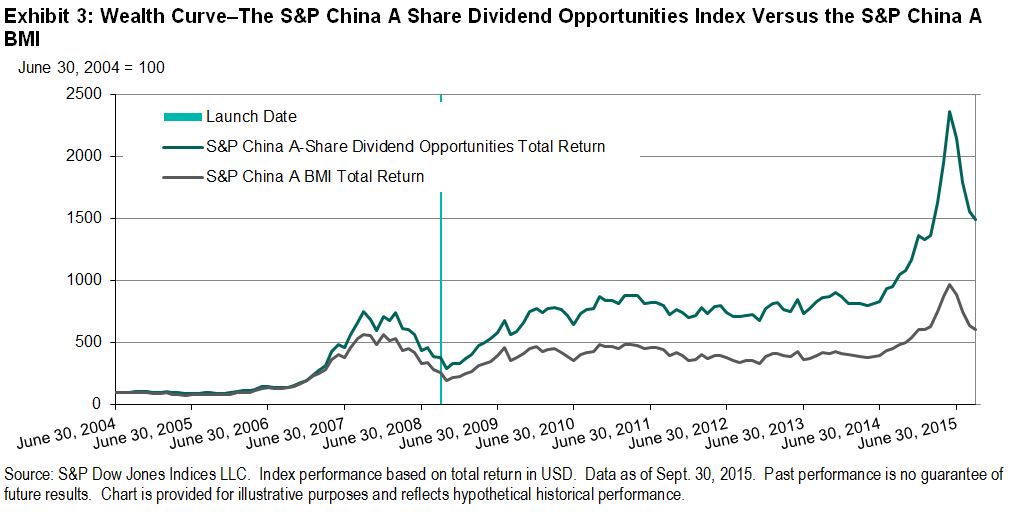
Exhibit 3 details the performance characteristics of the S&P BSE Dividend Stability Index over the 10-year period ending Sept. 16, 2015. The highest excess positive returns over the S&P BSE SENSEX were observed during the 2008 global financial crisis. This is consistent with the results we obtained earlier when we noticed that aggregate dividends paid by companies in S&P BSE LargeCap did not decrease during that period. The capital loss suffered was marginally offset by dividends. Over the same 10-year period, the S&P BSE Dividend Stability Index has provided a CAGR of 15.22%, which is 1.64% in excess of the S&P BSE SENSEX.
Exhibit 3: Performance Characteristics of the Indices
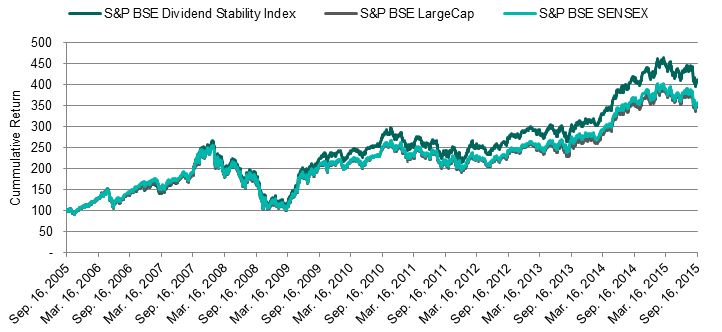

Source: S&P Dow Jones Indices LLC, Factset. Data as of Sept. 16, 2015. Past performance is no guarantee of future results. Charts are provided for illustrative purposes and reflect hypothetical historical performance.
Many strategies exist worldwide in which investors focus on dividends. With the Indian economy growing at a fast pace and the capital markets maturing, Indian investors may also seek to benefit from them.
The posts on this blog are opinions, not advice. Please read our Disclaimers.