Get Indexology® Blog updates via email.

In This List

Greek Fatigue

What’s Behind Biotech Gains?

Selection or Allocation?

Drivers of Technology ETFs

Active Funds Win Battles But Lose Wars

Greek Fatigue

Contributor Image
Craig Lazzara

Former Managing Director, Index Investment Strategy

S&P Dow Jones Indices

Greece’s financial problems have dominated headlines in the past week.  Here, e.g., are some excerpts from The Wall Street Journal:

Saturday 20 June.  “U.S. stocks ended  lower Friday… worries over Greece sent investors piling into ultrasafe Treasury bonds….”

Tuesday 23 June.  “U.S. stocks advanced Monday…lifted by gains in health-care and financial shares as well as optimism that Greece will eventually reach a bailout deal with its creditors.”

Wednesday 24 June.  “…stocks climb[ed] as Greece moved closer to a bailout deal with creditors.”

Today 25 June.  “U.S. stocks ended lower Wednesday, with the Dow Industrials posting their biggest one-day decline in nearly a month, as recent optimism about a bailout deal for Greece faded.”

Cynicism, of course, was invented in Greece, and today a cynic might wonder if headline writers were using Greece as a catch-all explanation for whatever had happened the day before.  Regardless of tomorrow’s news, we should keep three things in mind:

First, the situation is very fluid, as the Journal’s headlines demonstrate.  One day a compromise is near, the next day Greece and its creditors are back at an impasse.  If the way forward were obvious and clear, the parties would have found it by now.  For anyone not close to the negotiations (and perhaps even for those who are), predictions are necessarily speculative.

Second, there’s good reason to believe that a Greek default, if there is one, will be manageable.  The European financial system is much better able to adjust to default, and a possible “Grexit” from the euro, than it was when Greece’s problems first came to light.  In that sense, as we’ve argued before, a default will be allowed to occur only if it doesn’t really matter.

Third, even if a compromise is reached in the next week, Greece is unlikely to disappear from the headlines.  The Greek problem is inherently political and will require a political solution, and political solutions are seldom final.  Whatever we hear in the next few days, we are unlikely to have heard from Greece for the last time.  Timeo Danaos et dona ferentes.

The posts on this blog are opinions, not advice. Please read our Disclaimers.

What’s Behind Biotech Gains?

Contributor Image
Todd Rosenbluth

Director of ETF and Mutual Fund Research

S&P Capital IQ Equity Research

Biotechnology companies comprised 21% of the S&P 500 Health Care Sector index, making it the second largest industry, behind pharmaceuticals (42%), but ahead of health care providers (19%) and health care equipment & suppliers (14%). The industry has been a top performer in recent years, but S&P Capital IQ sees additional catalysts.

Biotechnology was the best performing industry, up 288.5% from 2011-2014, ahead of the S&P Health Care Sector and the broader S&P 1500 indices gains of 118% and 64%, respectively. Year to date through June 19, the 14% gain for industry ahead of the broader market’s 2.9% return.

According to Jeffrey Loo, S&P Capital IQ’s head of health care equity research, there are a number of catalysts. He highlighted that in 2014 several high profile blockbuster drugs were approved by the Federal Drug Administration (FDA) and sales for the seven biotech companies in the S&P 500 index rose 41.5% in 2014, while net income rose 85%. Looking forward, these companies have robust pipelines, with expectations that 10-12 compounds could be approved by the FDA in 2015 and are capable of achieving blockbuster sales in five years.

While the biotechnology industry has strong growth prospects, Loo points out that Amgen (AMGN) and Gilead Sciences (GILD) also pay dividends comparable to other more mature health care companies. S&P 1500 index biotech companies have a 0.8% dividend yield.

Despite the strong gains for the industry the last few years, biotech is far from expensive in our opinion. Indeed, the S&P 1500 Biotechnology industry trades at forward P/Es of 19.1X (2015) and 15.9X (2016), below that of the health care sector’s 19.7X and 16.8X near the broader S&P 1500 index’s 18.5X and 16.1X, respectively.

In the first five months of 2015, investors focused most of their equity ETF assets toward international products. However, among U.S. sector ETFs, diversified health care and biotechnology specific products were highly popular. Health care ETFs gathered $6.7 billion of fresh money.

S&P Capital IQ has rankings and research on more than 800 equity ETFs based on a review of the underlying holdings and key cost factors. In our research, we have found that some biotechnology and health care ETFs are market cap weighted, while others are equally weighted ad provide more exposure to small- and mid-cap companies. We think investors need to understand what’s inside these largely index-based products.

—————————————————————————————————–

S&P Capital IQ operates independently from S&P Dow Jones Indices.
The views and opinions of any contributor not an employee of S&P Dow Jones Indices are his/her own and do not necessarily represent the views or opinions of S&P Dow Jones Indices or any of its affiliates.  Information from third party contributors is presented as provided and has not been edited.  S&P Dow Jones Indices LLC and its affiliates make no representations or warranties of any kind, express or implied, regarding the completeness, accuracy, reliability, suitability or availability of such information, including any products and services described herein, for any purpose.


The posts on this blog are opinions, not advice. Please read our Disclaimers.

Selection or Allocation?

Contributor Image
Craig Lazzara

Former Managing Director, Index Investment Strategy

S&P Dow Jones Indices

Mr Burge: Do you know Lord Astor has made a statement to the police saying that these allegations of yours are absolutely untrue?
Mandy Rice-Davies: He would, wouldn’t he? 
At the trial of Stephen Ward, 29 June 1963, in The Guardian 1 July 1963

Like the unfortunate viscount, there’s a certain predictability to the advocates of active management, in which favorable news is routinely touted as evidence of active management’s ability to add value. Yesterday brought an example in a Merrill Lynch report indicating that 44% of U.S. equity managers had outperformed their benchmarks so far in 2015.

One obvious, and immediate, reaction is to note that if 44% outperformed, 56% must have underperformed.  That degree of underperformance is quite consistent with the historical record for large-cap U.S. managers.  And it’s also fair to point out that what the first five months of 2015 gave, the next seven months can take away.

What’s more interesting is Merrill’s observation that “Value managers had the highest hit rate of 77%, while 36% of Growth and 29% of Core managers beat their benchmarks.”  Why were value managers so much more successful than their non-value competitors?  The answer may be that, in the early months of 2015, value was relatively easy to beat.  The S&P 500 Value Index, e.g., was up only 1.55% through the end of May, vs. a total return of 3.23% for the S&P 500 itself and 4.80% for the S&P 500 Growth Index.  This suggests that the success of value managers is due not to their stock selection within the value universe, but rather to their ability to tilt away from value and toward growth.

Of course, there’s nothing wrong with a value manager’s tilting toward growth — assuming that his clients’ guidelines permit it, and assuming that he’ll know when to tilt back toward value.  In general, an active manager can add value by either stock selection or sector allocation, and there’s no insurmountable reason to prefer one technique to the other.  There are more potential opportunities in stock selection, of course (500 stocks vs. 10 sectors), but a manager who’s consistently good at allocation among sectors can be an excellent manager.

Asset owners may well be indifferent between receiving selection alpha and receiving allocation alpha. But they should understand the source of their managers’ value added.  And they should realize that allocation alpha can be fleeting.  If value starts to outperform growth, the allocation shoe will be on the other foot.

The posts on this blog are opinions, not advice. Please read our Disclaimers.

Drivers of Technology ETFs

Contributor Image
Todd Rosenbluth

Director of ETF and Mutual Fund Research

S&P Capital IQ Equity Research

While S&P Capital IQ consensus forecasts for second quarter 2015 EPS has declined sharply since the beginning of 2015, we think that the information technology sector should be one of the bright spots. Meanwhile, the sector is trading at a discounted P/E multiple. We believe investors can gain exposure to a number of favorable trends in the broader sector through diversified technology focused ETFs.

Earnings forecasts have been falling for all S&P 500 index sectors. On January 2, analysts expected second quarter 2015 S&P 500 earnings would increase 4.2% from the prior year. However, driven in part by weakness in the energy and consumer staples sectors, the S&P 500 forecast is now for a 4.2% decrease as of June 23. While forecasts for the tech sector have fallen as well, analysts now project 2.1% growth. For all of 2015, consensus forecasts call for 4.4% growth, ahead of the S&P 500’s 0.3% gain. However, the S&P 500 Tech sector trades at a 2015 P/E of 16.8X, below that of the S&P 500’s 17.7 multiple.

Angelo Zino, an equity analyst at S&P Capital IQ, believes there are number of catalysts that should support sector growth. Within hardware and storage, he expects double-digit smartphone growth in 2015 and 2016 to be augmented by tripling in wearables, albeit off a smaller base. He adds that data centers usage for cloud adoption is providing robust growth prospects to offset traditional storage.

Meanwhile, Zino expects that semiconductor fundamentals will experience a stronger second half of 2015 as PC inventory builds and Chinese demand for smartphones and mobile infrastructure increases. In addition, while there has been recent merger announcements, but he thinks there will be further consolidation.

During the first five months of 2015, investors put approximately $300 million into technology sector ETFs, in contrast to other sectors such as financials and utilities that experienced outflows.

S&P Capital IQ has rankings and research on more than 800 equity ETFs based on a review of the underlying holdings and key cost factors.

Please follow me @ToddSPCAPIQ to keep up with the latest ETF Trends.

—————————————————————————————————–

S&P Capital IQ operates independently from S&P Dow Jones Indices.
The views and opinions of any contributor not an employee of S&P Dow Jones Indices are his/her own and do not necessarily represent the views or opinions of S&P Dow Jones Indices or any of its affiliates.  Information from third party contributors is presented as provided and has not been edited.  S&P Dow Jones Indices LLC and its affiliates make no representations or warranties of any kind, express or implied, regarding the completeness, accuracy, reliability, suitability or availability of such information, including any products and services described herein, for any purpose. 

The posts on this blog are opinions, not advice. Please read our Disclaimers.

Active Funds Win Battles But Lose Wars

Contributor Image
Rick Ferri, CFA®

Author, Columnist and Managing Partner

Portfolio Solutions, LLC®

There have always been select actively managed funds that beat the cap-weighted indices market, and there always will be. But trying to find these funds before they outperform is exceedingly difficult, especially across multiple asset classes and styles. In addition, the outperformers may not pay well enough given the risk.  Active managers may claim victory in certain categories for certain periods of time, but poor performance in other categories drags down overall portfolio performance. These combined hurdles should make an all-index-fund portfolio particularly appealing to many investors.

Hurdle #1: Predicting Individual Active Winners
The success of index investing over actively managed funds in individual asset classes and styles has been widely documented. The S&P Dow Jones SPIVA® U.S. Scorecard is an extensive report that’s published semiannually at mid-year and year-end. SPIVA divides mutual fund return data into category tables covering different asset classes, styles, and time periods. There’s also a measure of survivorship bias and style drift for every category over each period. This accounts for funds that are no longer in existence or have had a change in investment style.

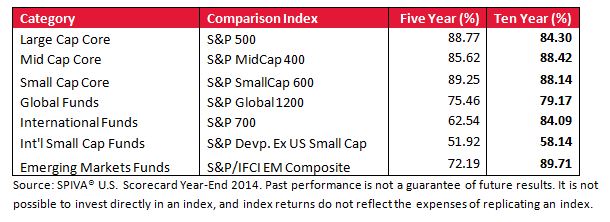
The SPIVA® U.S. Scorecard Year-End 2014 has data going back 10 years. Table 1 is a sampling of this data from a few popular equity asset classes and styles. The data represents the percentage of active funds that underperformed comparable indexes in each category for 5- and 10-year periods ended in 2014.

Table 1: Percentage of active funds that underperformed their comparison index

Capture

Hurdle #2: Building a Portfolio with Active Funds
Investors typically use multiple funds in their portfolios spanning several asset classes and styles. Although the underperformance of active funds in each individual category is well understood in the passive versus active debate, less well known is how portfolios of index funds have performed against portfolios of similarly structured active funds. Comparing these two types of portfolios is a relatively new area of research.

A Case for Index Fund Portfolios,  a White Paper by this author and Alex Benke, CFP®, of Betterment looked into this question. We created portfolios using only index funds and compared them to portfolios using only actively managed funds from a database free from survivorship bias.

As expected, index fund portfolios outperformed comparable active fund portfolios because index funds outperformed the average active fund in each investment category. Interestingly, we also found an all-index-fund portfolio went further than expected. It had a greater probability for beating portfolios of active funds than we would have expected from using a simple weighted average of the active versus passive performance in each category.

Why were portfolios of index funds beating more active fund portfolios than expected?

Hurdle #3: Good Outperformance, Greater Underperformance
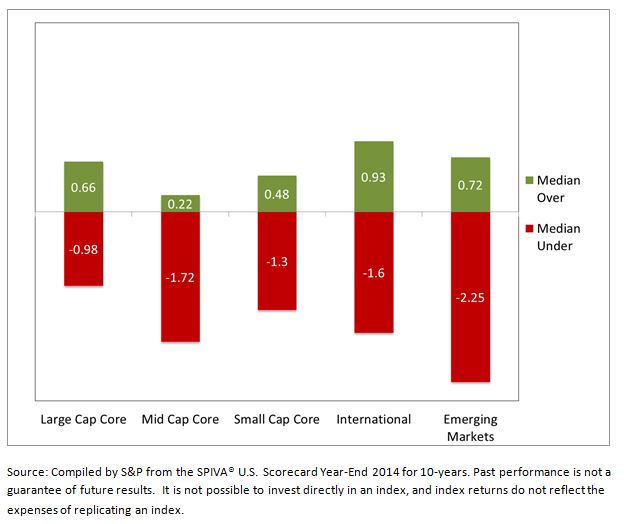
The reason all-index-fund portfolios outperformed active fund portfolios in greater numbers than expected comes from a second dimension of active fund underperformance. It’s not only the percentage of funds that underperform that matters, it’s the amount by which they underperform. Figure 1 is the magnitude of over- and underperformance of the median active fund in the primary equity asset classes in Table 1.

Figure 1: Magnitude of Active Funds’ Over- and Underperformance vs. Their Index

Capture

As shown in Table 1, the probability of an active fund’s outperformance was low in every investment category. To make matters worse, the funds that underperformed did so by a magnitude significantly greater than the alpha from funds that outperformed. The median over- and underperforming results are shown in Figure 1.

This is a double-whammy for active fund investors. It’s difficult to find active funds that will outperform, and when these funds do outperform, there’s not enough relative alpha to adequately compensate investors for taking active manager risk.

This risk is multiplied in an active fund portfolio. It may only take one or two underperforming active funds to drive the entire active fund portfolio under, because the magnitude of underperformance in the losing funds is expected to be higher than the magnitude of outperformance by the winning funds.

Too Many Hurdles to Win the War
It’s widely known that, over time, index investing has typically outperformed actively managed funds across every investment category. What’s less known is the benefit achieved from using a diversified portfolio of only index funds over a comparable portfolio of actively managed funds. The median alpha from the winning funds is low relative to the median underperformance from the losing funds, and this makes it tough to beat an all-index-fund portfolio, all the time.

The posts on this blog are opinions, not advice. Please read our Disclaimers.