Get Indexology® Blog updates via email.

In This List

WARNING: Hot Coffee May Burn

Ties with Exchanges Create Win-Win

The U.S. Congress and Investors Await Janet Yellen Comments

Emerging Markets: Don't Panic!

Re-Read Friday’s Employment Report

WARNING: Hot Coffee May Burn

Contributor Image
Jodie Gunzberg

Former Managing Director, Head of U.S. Equities

S&P Dow Jones Indices

There are too many funny coffee jokes to single one out but this one I found seriously relevant:

Coffee

Though I take my coffee black, I also take it seriously since it is one of the commodities in the S&P GSCI and DJ-UBS. Coffee has been the best performing commodity this year, up 23.9%.  As I mentioned in a prior post,  Coffee is up since the consumption of coffee in China is expected to grow by an annual rate of 9% for the next five years. This is not only from China’s large population but it’s rising middle class, which is expected to grow to 630 million people from 230 million.  Further, the International Coffee Organization reported “annual consumption should continue to grow at around 2.4% per year, and demand for coffee remains buoyant and should provide potential for further growth in the long term”.

Additionally, dry weather in Brazil has supported coffee returns this year. According to the International Coffee Organization, “The recent publication of official Brazilian production estimates for crop year 2014/15, which is due to start in April, suggests that output could fall for the second consecutive crop year, giving an initial forecast of between 46.53 and 50.15 million bags. This uncertainty over the 2014/15 crop, exacerbated by notably dry weather in some coffee-producing regions, has given support to coffee prices over the last month.”

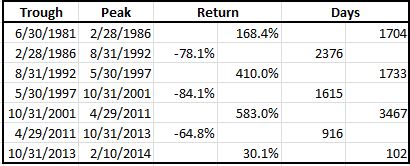
However don’t be fooled by the seemingly supportive economics. Let’s take a look at history because it looks like the 30.1% increase since October 2013 could be a head fake.  Below is a cumulative return chart of monthly index levels since the index inception in 1981:

Source: S&P Dow Jones Indices and/or its affiliates. Data from Jan 1981 to Feb 2014. Past performance is not an indication of future results. This chart reflects hypothetical historical performance. Please see the Performance Disclosure at the end of this document for more information regarding the inherent limitations associated with backtested performance.

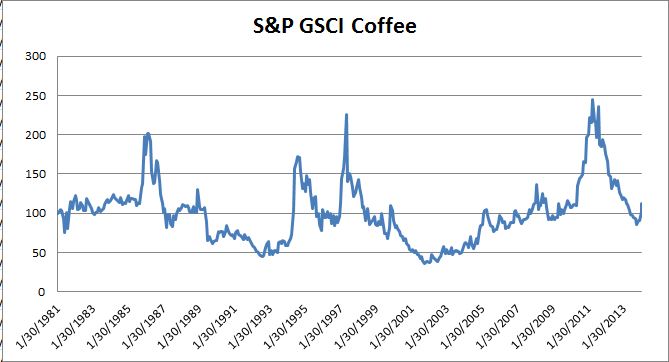
Historically, the major drawdowns have lasted on average about 5.5 years with a loss of 81.1%. The gains from trough to peak on average with the exception of the 2008 financial crisis period lasted 4.8 years with average gains of 387.1% that includes the gain between 2001-2011.  The last drawdown ending 10/31/2013 only lasted 2.5 years and was only down 64.8% before gaining 30.1% until now.  If the next drawdown looks like the past, it is possible to see a downward spiral for another 2.5-3 years with a loss of 58.6%.  Please see the table below:

Coffeepeaktrough

The posts on this blog are opinions, not advice. Please read our Disclaimers.

Ties with Exchanges Create Win-Win

Contributor Image
Alex Matturri

Former Chief Executive Officer

S&P Dow Jones Indices

Recently I had the pleasure to visit some of our key exchange partners in Asia and kick-start some milestone initiatives there. Our strategic agreements with the Korea Stock Exchange (KRX) and the Taiwan Stock Exchange (TWSE) further strengthen our presence in this fast-growing region and boost our profile as a leading international financial market index provider. Meanwhile, I’m equally excited to see that such relationships bring substantial benefits to the local markets.

On January 20, we formalized the agreement with the KRX to collaborate on global marketing and sales of KRX indices including the flagship index, the KOSPI 200. This agreement positions S&P Dow Jones Indices at the forefront of facilitating greater access to South Korea’s dynamic marketplace for global investors. Our proven experience in global sales and marketing will be put into full use to license and promote the KRX indices. The agreement also paves way for both parties to build a joint team for effectively developing new indices and knowledge sharing.

Following the KRX ceremony, we signed a strategic agreement with the TWSE on January 27. The agreement brings both parties to a closer working relationship for index maintenance, development, distribution, and co-branding. In conjunction with this, the first co-branded index — S&P/TWSE Taiwan Low Volatility High Dividend Index, which measures the performance of 40 high-yielding Taiwan companies — was announced. This newest innovation in indexing should facilitate greater access to equity market intelligence on Taiwan companies for investors both inside and outside of Taiwan.

These initiatives highlight our accelerating efforts to strengthen ties with bourses in key emerging markets in Asia and Latin America. The focus on these regions is a result of stronger economic growth relative to mature markets along with the increasing size of the investing public that looks for new investment channels. While several countries in the two regions have established derivatives markets, the use of exchange-traded funds and index-based strategies is still nascent, indicating huge room for growth.

The International Monetary Fund (IMF) recently forecast 6.5 percent growth in gross domestic product in developing Asia and 3.1 percent increase in Latin America for 2014[1], both of which are several notches higher than the predicted growth in the developed world. The continuous momentum in these regions, coupled with an increasingly sophisticated investment community, should bring growing business opportunities to us and our partners.


[1] International Monetary Fund, Oct. 2013, http://www.imf.org/external/pubs/ft/weo/2013/02/pdf/c1.pdf

The posts on this blog are opinions, not advice. Please read our Disclaimers.

The U.S. Congress and Investors Await Janet Yellen Comments

Contributor Image
Kevin Horan

Former Director, Fixed Income Indices

S&P Dow Jones Indices

  • The S&P/BGCantor U.S. Treasury Bond Index finished last week slightly down -0.02% after the market traded up at the end of the week in reaction to the Nonfarm Payroll number. This January indicator of employees on business payrolls (113k) disappointed expectation of 180k giving bond prices an upward push after three days of declines.
  • Treasuries prices are slightly up for the start of the week, Tuesday will open with the new Federal Reserve Chairman, Janet Yellen, presenting to Congress for the first time in her role. The markets will listen to learn more about her thinking and how the Fed will communicate its approach to monetary policy. In addition to a Congressional hearing, economic numbers scheduled for this week such as Wholesale Inventories (0.5% expected), MBA Mortgage Applications (0.4% prior), Retail Sales (0.0% expected), Initial Jobless Claims (330k expected) and the University of Michigan Confidence number (80.4 expected) will all point to if the U.S. economy is continuing to progress forward or stalling.
  • The S&P U.S. Issued Investment Grade Corporate Bond Indexclosed last week up 1.95% year-to-date. On the month, Health Insurers and Health Care Facilities like Ohio National Financial Services and, The City of Hope, and The Mayo Clinic are leading the way. On the downside, Electrical Utilities which account for 6% of the index are down -0.02%.
  • The S&P/LSTA U.S. Leveraged Loan 100 Indexis down -0.04% month-to-date. Names like Laureate Education Inc., TXU Corp., and Cengage Learning have moved this index lower on the month. In high Yield as measured by the S&P U.S. Issued High Yield Corporate Bond Index, the index is up slightly at a 0.22% for the month.  Year-to-date the index is up 0.98%, though investment grade’s year-to-date return of 1.95% is out shining high yield as investors who have been chasing yield move back up the credit rating scale.

Data as of February 7, 2014 | Leverage Loan data as of February 9, 2014


The posts on this blog are opinions, not advice. Please read our Disclaimers.

Emerging Markets: Don't Panic!

Contributor Image
Tim Edwards

Managing Director, Index Investment Strategy

S&P Dow Jones Indices

Currencies and equities across various countries classified as “emerging” have come under increased scrutiny in the past few weeks, with more excitable commentators seeing signs of a crisisShould broad-based index followers be worried? Perhaps not.

On the one hand, the tapering of U.S. quantitative easing has triggered flights of “hot money” from countries (like Turkey) that were deemed overly dependent on U.S. largesse, those subject to political instability (Brazil) and those with potentially systemic local risks (a real-estate bubble and financial liquidity crunch in China).

On the other hand, this is not 1997.  Except for Turkey, the majority of emerging markets have not piled on foreign currency debt, and years of relative underperformance has given rise to attractive valuations compared to the developed world.  Russia – for example* – is trading at a price-to-book ratio of 0.77 and a dividend yield of over 4%.

Considering all such “emerging” markets as equivalent is convenient, but misleading.  Recent sell-offs have been highly discriminatory and selective. The dispersion among stocks and countries within emerging markets is greater than for developed market equities. 

One might think it therefore matters which countries you invest in.  That’s certainly true.  But it also means that there is a strong diversification effect, captured by broad-based indices.  If the risks within emerging markets are particular to each country, the effect of aggregating those risks is highly dilutive.  If you hold a concentrated position in any one country, you might be wise to worry.  If you hold a diversified position across multiple countries, maybe not so much.

The volatility markets provide a current confirmation.  Recently, the CBOE began publishing implied volatility levels for emerging markets.  Like the VIX® (to which it is related) the VXEEM Index uses the prices of options to estimate how much volatility is predicted by the market – in this case for a broad-based emerging market ETF:

VXEEM

             Source: CBOE, as of February 7th, 2014

Friday’s close of 26.5 is higher than current levels of the VIX; that should be no surprise – emerging markets are usually more volatile than developed markets.  But it is fairly low on a historical basis: implied volatility is just below its three-year average.  The options market is not overly worried about broad-based emerging market exposure: in an environment where the flows of flighty capital can prove decisive, this is useful information.  The balance between fear and greed is not as tilted towards fear as the headlines might suggest.

 _______________________________________________________

* Based on previous 12 month dividends and FY0 book value for S&P Russian Federation BMI. For purposes of comparison, the S&P United States BMI has a dividend yield of 1.8%, and price-to-book ratio of 2.61, as of 31st January, 2014.

The posts on this blog are opinions, not advice. Please read our Disclaimers.

Re-Read Friday’s Employment Report

Contributor Image
David Blitzer

Former Managing Director and Chairman of the Index Committee

S&P Dow Jones Indices

Last Friday’s employment report for January was greeted with groans and sighs.  The weak payrolls number in December was revised upward by only a thousand jobs and the January figure, at 113,000, was a big disappointment.  While the unemployment rate did drop to 6.6% from 6.7%, the change was as small as could be reported and most Wall Street analysts believe that the payrolls number is a far more reliable number anyway.  Neither payrolls nor the unemployment rate should be ignored – they tell different, though hopefully consistent, stories about different elements of the economy.  As weak as the payrolls were, the unemployment rate and the rest of the data from the household survey offer some encouragement.

ruc

First, the unemployment rate is falling consistently so the small drop of 0.1 percentage points was more likely a real change than random noise.  (see first chart) Second, other data in the household survey are also showing some continuing improvements.  As noted on the Wall Street Journal’s economics blog, the employment-population ratio – the percentage of people working – is creeping up since last fall and reached a new high since the recession ended in 2009.  Many complain the unemployment rate is biased because when people drop out of the labor force, they are not counted as unemployed.  The employment-population ratio counts people even if they drop out. The gains are still small, but appear to be going in the right direction. (see second chart)  On top of these measures, other numbers looked better as well. Labor force participation increased and the number of people working part time because they couldn’t find full time jobs went down. Whether the good news continues remains to be seen, but the trends are encouraging.

emp-pop

Some worry that the Fed may accelerate its tapering or even raise interest rates if the unemployment rate passes 6.5%. Not to worry. The Fed is not likely to move any time soon.  The economy is still weak and inflation is too low, so we are likely to remain at the zero lower bound for awhile longer.

Data for charts are from the US Bureau of Labor Statistics via the St. Louis Federal Reserve Bank’s service, FRED. Data are monthly, January 2000 to January 2014.

The posts on this blog are opinions, not advice. Please read our Disclaimers.