Get Indexology® Blog updates via email.

In This List

The Hunt For Red October

Sukuk – Let’s Do the Profit Sharing!

What Me Worry

The Shrinking Supply of Alpha

High Yield Munis Burned by Tobacco Bonds

The Hunt For Red October

Contributor Image
Kevin Horan

Former Director, Fixed Income Indices

S&P Dow Jones Indices

In the iconic film The Hunt for Red October, released in 1990, the cold war standoff between the U.S. and the Soviet Union is taken new to heights. Based on a novel of the same title written by the recently deceased author Tom Clancy, a CIA analyst finds himself in over his head in the middle of an international crisis. Packed with too many stars to mention, Jack Ryan, played by Alec Baldwin, finds himself on the nuclear submarine U.S.S. Dallas trying to convince its Captain, Bart Mancuso, that a Soviet submarine they are chasing is actually looking to defect, not to attack the U.S. with nuclear weapons as the Soviets claim. As the two submarines sail towards each other, Captain Mancuso says to Ryan, “The hard part about playing chicken is knowin’ when to flinch.”

Although not quite as theatrical or as thrilling as in the movie, the U.S. economy is facing a similarly tense situation today. Though the political haranguing over the debt limit has been quite public, its effect on investments has, so far, remained relatively unseen. Equity markets, as measured by the S&P 500 Index, have been steady, with average price actions that would not garner significant attention. The largest decline this month was a 20.6 point drop on Oct. 8, which was followed by four days of gains totaling 55 points. As for bonds, the S&P/BGCantor Current 10-Year U.S. Treasury Index, which measures the performance of the on-the-run 10-year Treasury, is down -0.53% month-to-date while its yield-to-worst has widened by 0.07 basis points (bps). Investment-grade corporate bonds, as measured by the S&P U.S. Issued Investment Grade Corporate Bond Index, are up 0.09% for the month, while lower quality high-yield bonds represented by the S&P U.S. Issued High Yield Corporate Bond Index are up 0.7% on the month.

So far everything seems like business as usual, with all eyes watching Washington to see if something more significant develops. If there have been any worrisome waves from this round of partisan bickering, they would be in the U.S. Treasury bill market. The yield-to-worst on the S&P/BGCantor U.S. Treasury Bill Index has widened by 13 bps. This is a yield that, up until the end of September, has averaged 6 bps for the year. The maximum change in daily yield for the same time period had been just 3 bps. Funding for the U.S. government is getting more expensive and the clock is ticking. The Treasury’s October 17th, deadline is quickly approaching and, like the plot of Tom Clancy’s novel, the ramifications of failure will have a great impact both politically and economically.

The posts on this blog are opinions, not advice. Please read our Disclaimers.

Sukuk – Let’s Do the Profit Sharing!

Contributor Image
Michele Leung

Former Director, Fixed Income Indices

S&P Dow Jones Indices

It all started with the Quran, the religious book of Islam, which guides all aspects of Muslim’s life. It is one of the fundamental sources of the Islamic (Shariah) law. The Shariah law has strict rules on finance; it forbids both interest “Riba” and uncertainty “Ghara”. It also prohibits a number of practices, such as any form of gambling “Qimar” and business that are related to alcohol, tobacco and immoral entertainment “Haram”.

Since interest-bearing bonds are not allowed, the emergence of Sukuk provided a new source of financing in this relatively restrictive environment. Sukuk are regarded as a highly innovative financial instrument in Islamic finance; it also facilitates rapid infrastructure funding and capital market development in the regions.

According to Auditing and Accounting Organization of Islamic Financial Institutions (AAOIFI), Sukuk are defined as “the certificates of equal value representing undivided shares in ownership of tangible assets, usufruct and services or in ownership of the asset of a particular project or special investment activity”. Unlike conventional bonds, Sukuk are based on a variety of contracts to create financial obligations and the returns to investors are considered as profit sharing, not interest!

Sukuk are becoming a popular investment asset class in both Islamic and non-Islamic communities. In addition to attractive yields, Sukuk are also perceived as higher quality assets since the Sukuk holders are in actual ownership of the tangible underlying assets. The primary market is active, for example, we had Abu Dhabi Investment Council and Republic of Turkey tapped onto the market in the past few weeks.

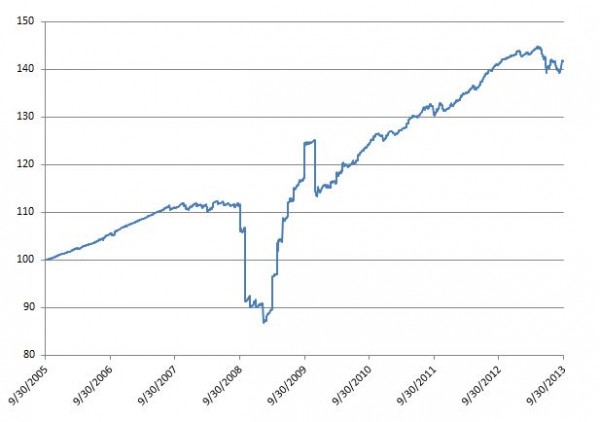
The Dow Jones Sukuk Total Return Index was created as an independent benchmark for investors seeking to track the performance and characteristics of U.S. dollar denominated and investment grade Sukuk issued in the global markets. The index rose 42% since it was first valued on September 30, 2005. On 10/14/2013, the yield to maturity was 3.10% with a duration of 4.35. The index is is currently tracking $33 billion of assets.

So how are the constituents of the Sukuk indices screened for Shariah compliance? First they must be certified as Sukuk by a globally recognized Shariah Supervisory Board. Second, they must comply with AAOIFI standards for tradable Sukuk. Lastly, the underlying assets must comply with Shariah principles, such the primary business are not engaged in any of the so-called prohibited industries.

As the Sukuk market evolves both in Asia and the Middle East, new Sukuk indices continue to be developed to meet growing investor demand for additional transparency into those markets. For example, the S&P MENA Sukuk Index was recently launched to specifically track the performance of Sukuk in the Middle East and North Africa (MENA) markets. These indices are designed to be broad benchmarks for both funds and ETFs.

The success of the continued Sukuk market expansion will rely on the depth of the secondary market. Global growth in the use of fixed income ETFs is an important trend and the introduction of ETFs in less liquid asset classes like Sukuk can definitely help drive liquidity.

Exhibit 1: Dow Jones Sukuk Index – Total Return Performance
Exhibit 1: Dow Jones Sukuk Index – Total Return Performance                                                                                Source: S&P Dow Jones Indices LLC and/or its affiliates. Data as of September 30, 2013. The Chart is provided for illustrative purposes. Past performance is no guarantee of future results. Historic returns included back-testing.


The posts on this blog are opinions, not advice. Please read our Disclaimers.

What Me Worry

Contributor Image
David Blitzer

Former Managing Director and Chairman of the Index Committee

S&P Dow Jones Indices

While the stock market was up sharply on Thursday and rose a bit more on Friday amidst rumors of some talks in Washington,  not everyone thinks we’re  out of the woods.  In fact, other parts of the financial system are taking precautions in case the worst – a government default – happens.  Hopefully both these trends will continue:  some large market moves combined with disaster preparation might convince Washington that Wall Street really does want all this nonsense settled, the debt ceiling raised, the government re-opened and (maybe) Congress to get back to work.  The market moves this past week were a start but not big enough to carry a lot of conviction. Moreover, a big drop in response to stubbornly little progress early in the week might have scared Congress into some activity.

The disaster planning is mostly about Repos – short term collateralized loans.  The most common collateral since the financial crisis has been short term treasury securities.   In normal times, the credit quality of treasuries is as close to impeccable as anything. These are not normal times.  Discussions about re-writing the legal agreements behind repos are going on, some money market funds are selling treasuries for fear of a default and Senator Sherrod Brown, a Democrat on the Senate Banking Committee asked two major banks which arrange some $2 trillion of repos what would happen in a default.  In Hong Kong, the exchange is asking for additional collateral in some transactions.

Understanding and planning for investment risks is never easy.  The hardest risks to plan for are those with a very small chance of occurring, but if they happen the damage would be immense.  Outside of finance these might be things like nuclear power plant meltdowns or 100-year storms.  Yes, such things do happen: ask Japan about Fukushima or recall “Super Storm Sandy” in New York City about a year ago.  A default by the US treasury – the key underpinning and support for the world’s financial system  — would be a low probability event causing immense damage.

The posts on this blog are opinions, not advice. Please read our Disclaimers.

The Shrinking Supply of Alpha

Contributor Image
Craig Lazzara

Former Managing Director, Index Investment Strategy

S&P Dow Jones Indices

Recently we attended a conference at which many hedge fund representatives were present. Not surprisingly, there was much discussion of the ability of hedge funds, and by extension active managers generally, to generate alpha. This raises an obvious question: what is the market’s capacity to produce alpha?  Is there a natural limit to investors’ ability to earn excess returns?

One way to frame this issue is to ask a related question: how much beta is there? This turns out to be a fairly easy computation. As of September 30, 2013, the total value of the U.S. stock market was $18.8 trillion. So in aggregate, there’s $18.8 trillion of U.S. beta available.

If the market’s “beta capacity” is $18.8 trillion, what is the market’s “alpha capacity?” The answer, in aggregate, is $0. There is no natural source of alpha. I can earn a positive alpha only if some other investor earns a negative alpha. Successful (or lucky) active equity managers, in aggregate, can only produce positive alpha if less successful (or unlucky) managers endure negative alpha. And of course trying to earn alpha costs more than passive management, whether the quest is successful or not. So it’s not surprising that a majority of active equity managers typically underperforms a passive benchmark, nor is it surprising that passive management has consistently gained market share relative to active management.

All of which is relevant to our initial question about the aggregate supply of alpha. Consider two scenarios. First, assume that the $18.8 trillion U.S. equity market is entirely actively managed.  Then $9.4 trillion is controlled by below-average managers, and $9.4 trillion is controlled by above-average managers.  Assume that the average below-average manager underperforms by 2% per year.  Then the total alpha available for the above-average managers to harvest is $188 billion (2% of $9.4 trillion).

Now assume that 10% of the market is controlled by index funds, leaving $16.92 trillion for active managers. Half of this value will underperform. Let’s assume that the average below-average manager now underperforms by 1.5% per year (which is consistent with the assumption that the worst active managers are index funds’ first victim). Then the aggregate alpha available to the above-average managers is $126.9 billion (1.5% of half of $16.92 trillion). The aggregate alpha pool has fallen by more than 30%.

By reducing the number of potentially-underperforming active managers, indexing reduces the rewards for those that remain.

The posts on this blog are opinions, not advice. Please read our Disclaimers.
High Yield Munis Burned by Tobacco Bonds

Contributor Image
J.R. Rieger

Former Head of Fixed Income Indices

S&P Dow Jones Indices

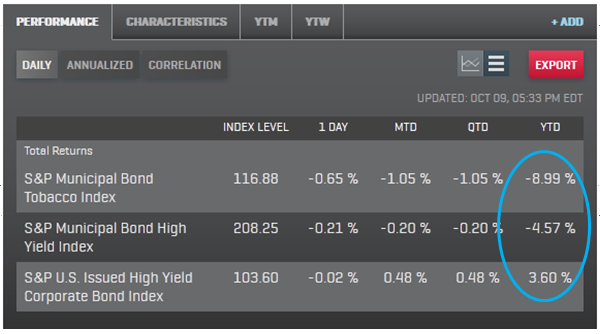
Tobacco settlement  bonds tracked by the S&P Municipal Bond Tobacco Index are down nearly 9% year to date as yields have risen by over 255bps as the credit risk of these long duration bonds is questioned.  Recent arbitration results have been positive but uncertainty over future disputes and tobacco consumption are pulling these long duration bonds down.  The average duration of the S&P Municipal Bond Tobacco Index is over 11.5 years.

The S&P Municipal Bond Index, which includes tobacco settlement bond issues that are  below investment grade, is down over 4.5% year to date with yields rising by over 150bps.  The tobacco bond exposure helps lengthen the duration of the index to over 9 years.

By comparison, the S&P U.S. Issued High Yield Corporate Bond Index has a duration of over 4.8 years and is up 3.6% year to date.

Source: S&P Dow Jones Indices LLC and/or its affiliates. Data as of October 9, 2013. Charts and graphs are provided for illustrative purposes. Past performance is no guarantee of future results.

To learn more on the municipal bond market, join us for an event in New York next Thursday, “Where are Municipal Bonds Creating Opportunities for You?” Keynote speaker, Jim Lebenthal, co-founder of Lebenthal Asset Management, will examine the overall health of the market and explore current opportunities in U.S. infrastructure and municipal bonds.  Click here to register and for more details.

The posts on this blog are opinions, not advice. Please read our Disclaimers.