In a prior post, we saw that during sharp rising interest rate periods, the S&P 500® Low Volatility Rate Response fared better than the S&P 500 Low Volatility Index, even though both indices generally underperformed the S&P 500. In this post, we examine if there is a relationship between the magnitude of interest rate changes (positive and negative) and the relative performance between the two indices. We first plot the historical monthly excess returns of the rate response index over the low volatility index against monthly changes in interest rates (see Exhibit 1).
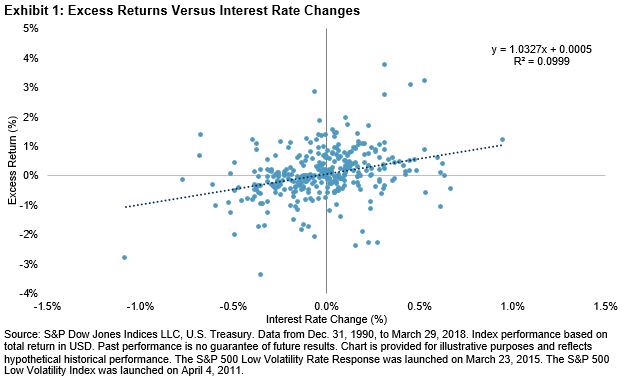
Exhibit 1 shows a clear trend in performance differential for 1) the direction and 2) the magnitude of interest rate changes. The linear regression trend line (the dotted line going across the chart) has a coefficient of 1.03 to interest rate changes. With a coefficient t-stat of 6.01, the results are statistically significant at the 99% confidence interval.
The coefficient approximates that for every 1% change in interest rates, the excess returns over the low volatility index is to change by roughly 1.03%. Given the positive slope coefficient, the rate response index generally outperformed the low volatility index when interest rates rose and underperformed when rates declined. Moreover, as shown by the upward-sloping regression line, the larger the increase in interest rates, the higher the excess return for the rate response index was compared with the low volatility index.
We also checked to see if the results held true for interest rate changes that were longer than one month. Exhibit 2 charts the rolling 12-month excess returns of the rate response index versus the low volatility index on the primary axis and the 12-month change in interest rates on the secondary axis.
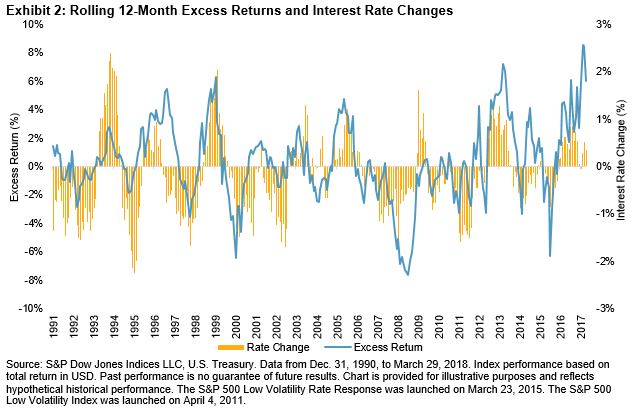
Exhibit 2 shows that the relationship between relative excess returns and changes in interest rates persisted for longer time horizons. As interest rates increased, the rate response index outperformed, and when rates declined, the low volatility index outperformed. Since the comparison goes back to 1991, the relationship can be observed throughout multiple market cycles. Exhibit 3 shows the hit rate and average excess returns for the rolling 12-month periods.
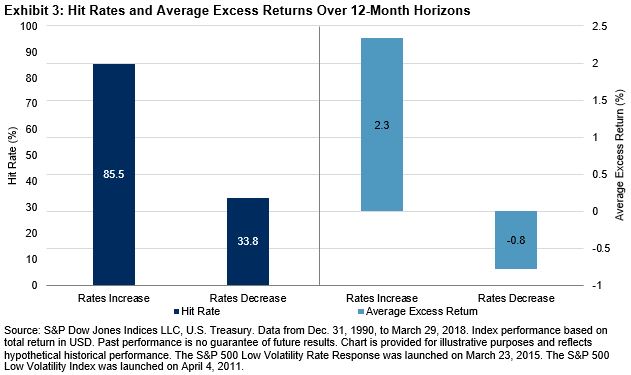
For the 12-month time horizons, when rates increased, the rate response index outperformed the low volatility index during nearly 86% of the periods, with an average outperformance of about 2.3%. When rates decreased, the low volatility index outperformed the majority of the time, with an average outperformance of 0.8%.
While the rate response index generally underperformed the S&P 500 in rising interest rate periods, it fared better than the low volatility index in the short-term (one month) and long-term (12 months). The results in this blog further confirm initial findings from the first blog that the rate response strategy reduces interest rate risk of a low volatility portfolio. In the final post of this series, we will investigate the performance of the two indices in down markets.
The posts on this blog are opinions, not advice. Please read our Disclaimers.