Get Indexology® Blog updates via email.

In This List

Greek Myths and Icelandic Sagas: Reclassifications in the Global Market Library

Inside the September 2026 S&P 500 Momentum Index Reconstitution

The Evolution of the S&P USD Select Leveraged Loan Index

Charting the Clean Energy Odyssey

An Alternative Approach to Autocall Indices

Greek Myths and Icelandic Sagas: Reclassifications in the Global Market Library

Contributor Image
Diego Zurita

Senior Analyst, Global Equities & Thematics

S&P Dow Jones Indices

On Sept. 21, 2026, two markets crossed important thresholds in the S&P Dow Jones Indices (S&P DJI) global equity benchmark. Greece finished an odyssey back to developed market status after a 12-year hiatus, while Iceland rose, saga-like, to emerging market status. In this blog, we look at the details of why these changes happened and their impact on the composition of global benchmarks.

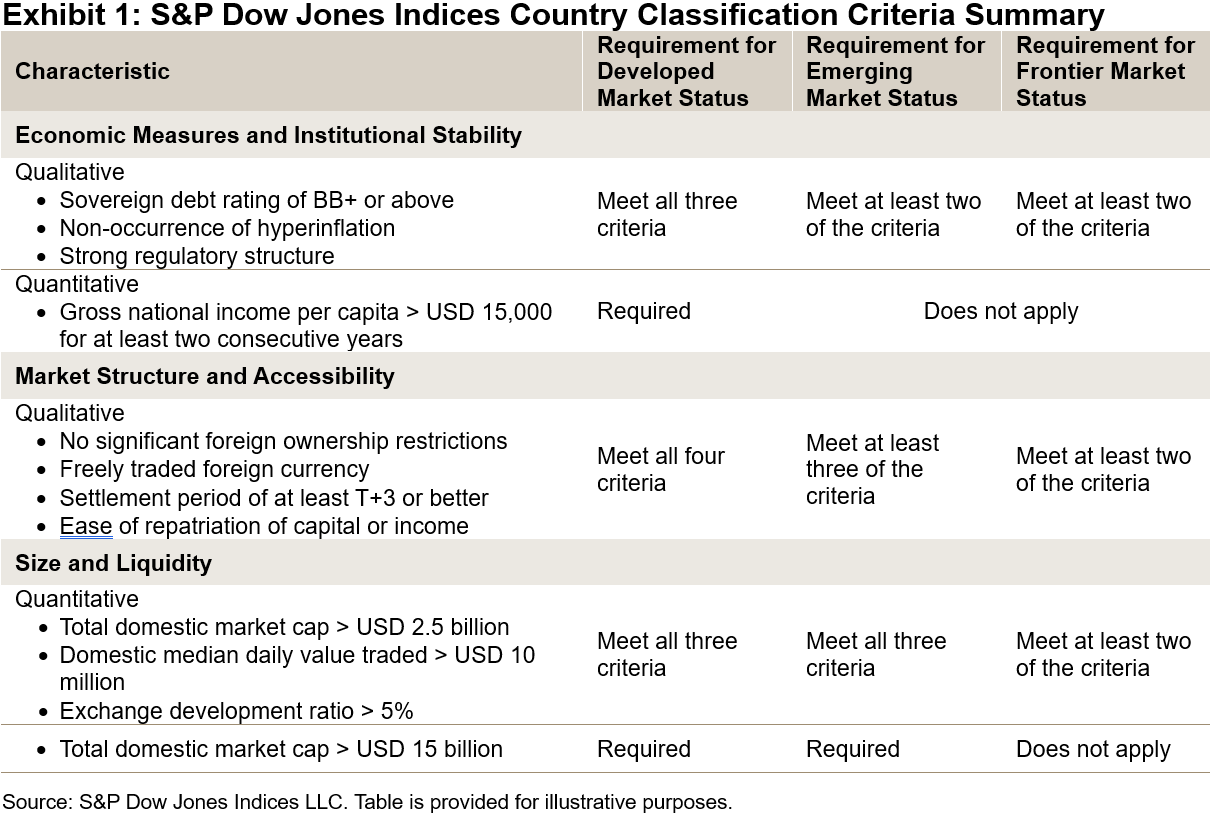
But first, how does S&P DJI decide how to classify a country? S&P DJI’s country classification framework1 relies on both quantitative and qualitative factors, as shown in Exhibit 1, as well as feedback from market participants. Based on these inputs, an index committee makes the final classification decision.
An Odyssey Home: Greece Returns to Developed Market Status

Before the Greek debt crisis, Greece was classified as a developed market. Amid the sovereign debt turmoil and long recession that followed, S&P DJI announced Greece’s move to emerging market status in 2013, with the change taking effect in September 2014. For over a decade, the country experienced significant socioeconomic challenges and hardships, including defaulting on an IMF payment,2 persistent high unemployment and rising poverty.3 By 2018, after a period of reforms and fiscal discipline, Greece secured a debt-relief agreement that began to change the country’s credit trajectory.4, 5 As of October 2025, the country held an S&P Global Rating of BBB/A-2 with a stable outlook,6 and the economy has resumed growth.7 Greece’s journey back to developed market status was nothing short of an odyssey.

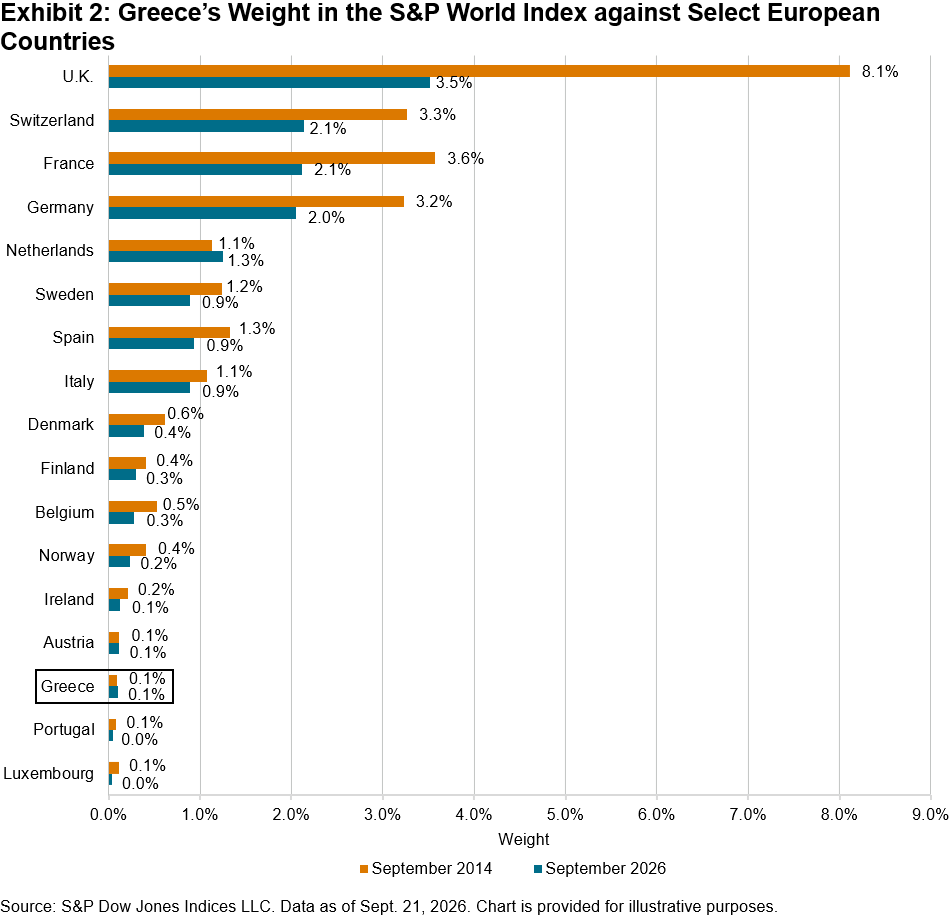
Greece joined S&P DJI’s developed market benchmarks in September 2026. The country is now part of the S&P World Index, accounting for a weight of about 0.1%, not too different than the weight it had before its reclassification to emerging market status (see Exhibit 2). However, the stock market has changed. As of the September 2026 rebalance, the float-adjusted market capitalization (FMC) of the S&P Greece BMI was USD 110.8 billion, compared to USD 29.1 billion before being moved to emerging markets. The number of constituents also grew, from having 20 stocks across 7 GICS® sectors to including 51 stocks across 10 GICS sectors. Notably, the weight of the Financials sector increased from 31.5% to 49.3%, while the weight of the Consumer Discretionary and Communication Services sectors decreased from 19.8% to 4.0% and from 11.0% to 3.3%, respectively.
After the Economic Ragnarök: A Frontier No More

While Greece’s odyssey was rooted in a sovereign debt crisis, Iceland’s story began with a very different kind of financial collapse. Just weeks after Lehman Brothers declared bankruptcy in 2008, a wholesale funding refinancing failure and run of foreign-currency deposits triggered the collapse of all three major Icelandic banks. These banks were unsustainably large, holding assets equivalent to more than 10 times the size of the country’s GDP, mostly denominated in foreign currency.8 Through an IMF bailout, austerity, capital controls and banking reforms, the country managed to resolve the crisis.9 Iceland has since lifted capital controls10 and, since October 2025, has held an A+/A-1 rating from S&P Global Ratings with a stable outlook.11 While its stable economy has benefited from a rebound in tourism12 and, as of September 2025, more than one-half of the FMC of its stock market came from the Financials sector, policymakers are pushing to diversify the economy.13 Just as Norse mythology tells of a new world born from the ashes of Ragnarök, Iceland’s economy had a rebirth and just recently received an upgraded classification after meeting the required criteria.

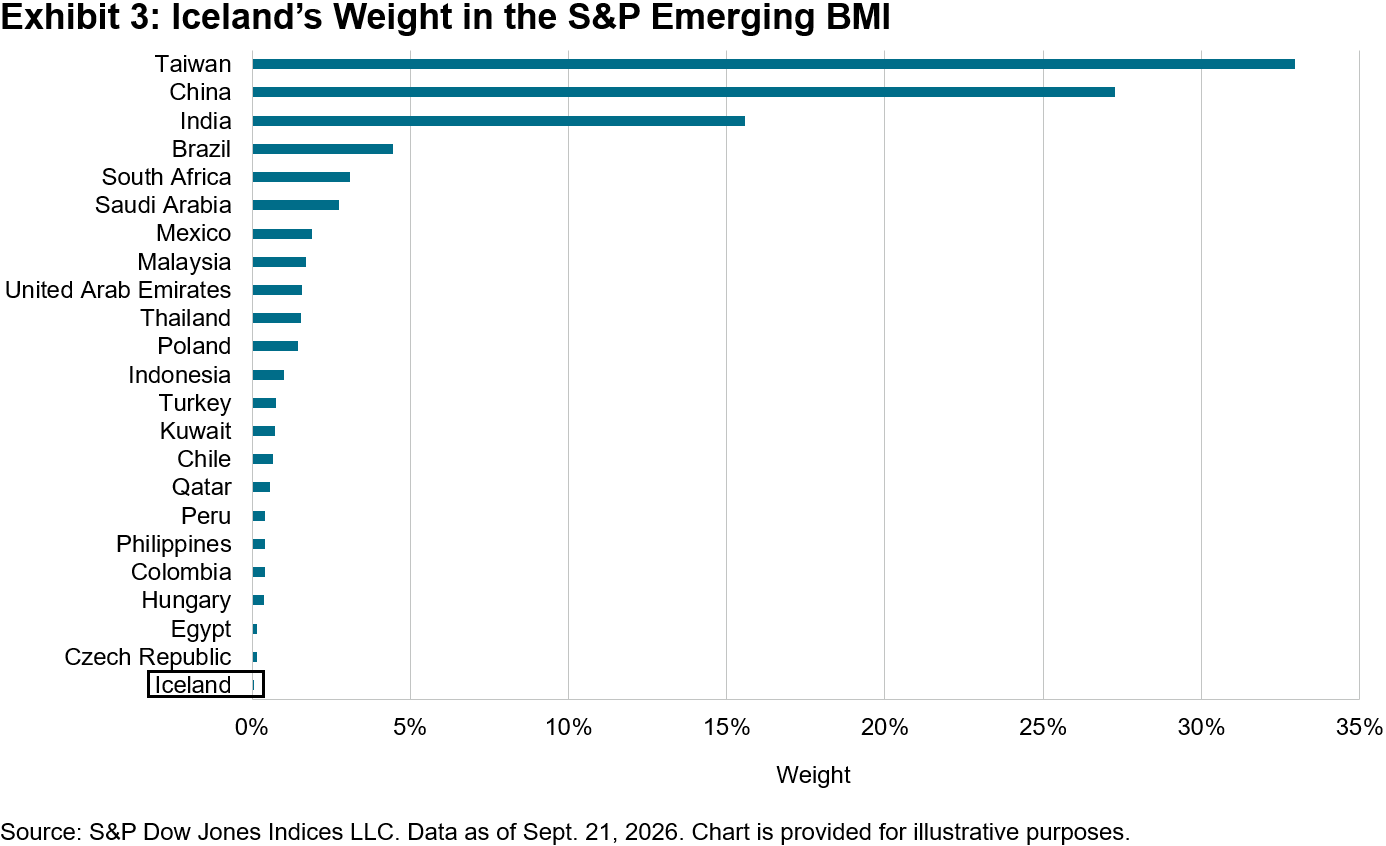
Previously classified as a frontier market, Iceland has now joined emerging market benchmarks. As of Sept. 21, 2026, the S&P Iceland BMI included 12 stocks across 7 GICS sectors, with an FMC of USD 9.5 billion. At initial inclusion, the country was the smallest constituent of the S&P Emerging BMI, with a weight of 0.07% (see Exhibit 3).
Though these countries hold modest weight, their new status changes the investor base tracking them. The tales of Greece and Iceland illustrate the dynamic nature of market classifications. Developments around a country’s economic health, market infrastructure and accessibility can lead to a reclassification in the global market library.

1 See the S&P Dow Jones Indices Country Classification Methodology for more information.

2 “Greece debt crisis: IMF payment missed as bailout expires,” BBC, July 1, 2015.

3 Rodgers, Lucy and Nassos Stylianou, “How bad are things for the people of Greece?” BBC, July 16, 2015.

4 “Greece hails ‘historic’ debt relief deal,” BBC, June 22, 2018.

5 Hatzidakis, Konstantinos, “Greece’s Remarkable Recovery,” IMF, June 2025.

6 “Greece Affirmed At ‘BBB/A-2’; Outlook Stable,” S&P Global Ratings, Oct. 17, 2025.

7 “Economic forecast for Greece,” European Commission, May 21, 2026.

8 Baudino, Patrizia, Jon Thor Sturluson and Jean-Philippe Svoronos, “The banking crisis in Iceland,” Bank for International Settlements, March 2020.

9 Tranøy, Bent Sofus and Throstur Olaf Sigurjonsson, “Back from the Brink: Iceland’s Successful Economic Recovery,” Successful Public Policy in the Nordic Countries: Cases, Lessons, Challenges, Oct. 20, 2022.

10 “Iceland ends capital controls after more than eight years of restrictions,” Reuters, March 12, 2017.

11 “Iceland ‘A+/A-1’ Ratings Affirmed; Outlook Stable,” S&P Global Ratings, Sept. 5, 2025.

12 “OECD Economic Surveys: Iceland 2025,” OECD, June 26, 2025.

13 “Industrial Policy – A Growth Plan to 2035,” Prime Minister’s Office, Iceland, April 2026.

The posts on this blog are opinions, not advice. Please read our Disclaimers.

Inside the September 2026 S&P 500 Momentum Index Reconstitution

Contributor Image
Wenli Bill Hao

Director, Factors and Dividends Indices, Product Management and Development

S&P Dow Jones Indices

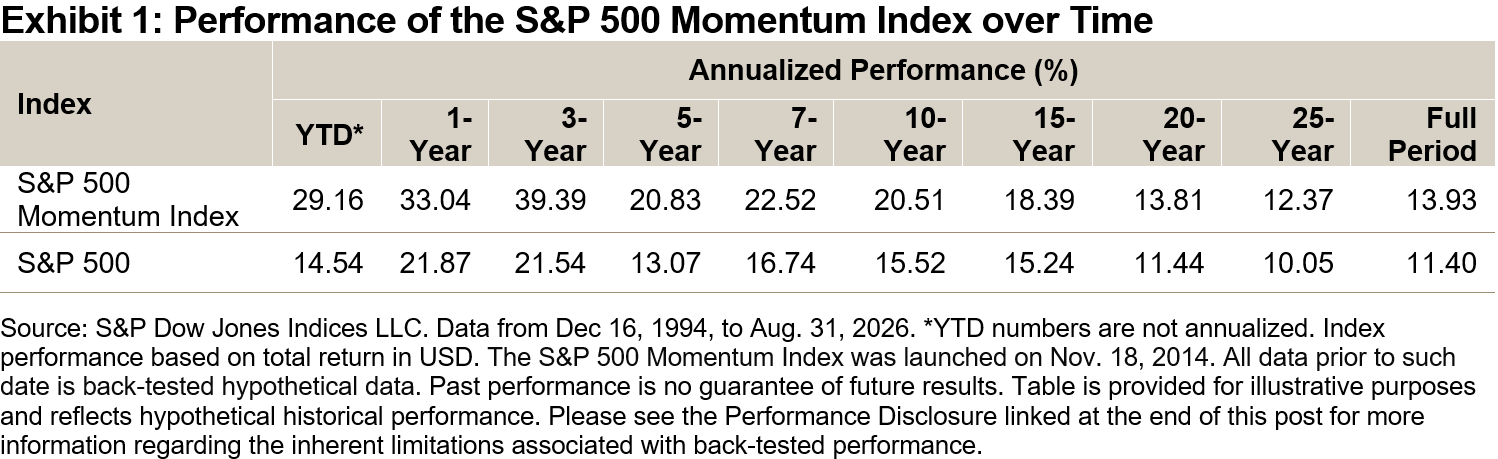
The S&P 500® Momentum Index tracks the top 20% of S&P 500 stocks by 12-month risk-adjusted price momentum.1 Backed by persistent market trends, the index has outperformed significantly relative to the broader market in recent years (see Exhibit 1).

The S&P 500 Momentum Index rebalances semiannually after the close of the third Friday of March and September, using the final business day of February and August as reference dates, respectively. This blog examines the recent September rebalance, detailing constituent changes, sector and industry group weights, and pre- and post-rebalance factor characteristics.

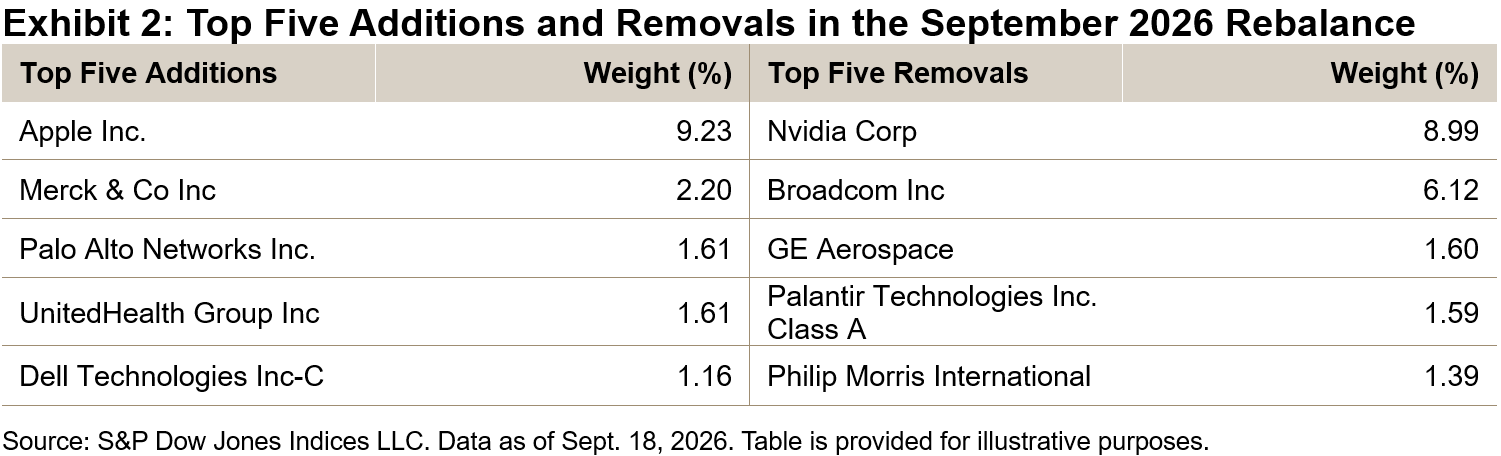
During the September rebalance, the index added and removed 54 constituents; Exhibit 2 highlights the five largest additions and removals. Notably, Apple entered the index with a weight of 9.23%, while Nvidia and Broadcom were removed (which were previously weighted at 8.99% and 6.12%, respectively). Following the rebalance, the index included two Magnificent 7 companies: Apple (9.23%) and Alphabet (8.95% between the combined share classes).

Sector Breakdown

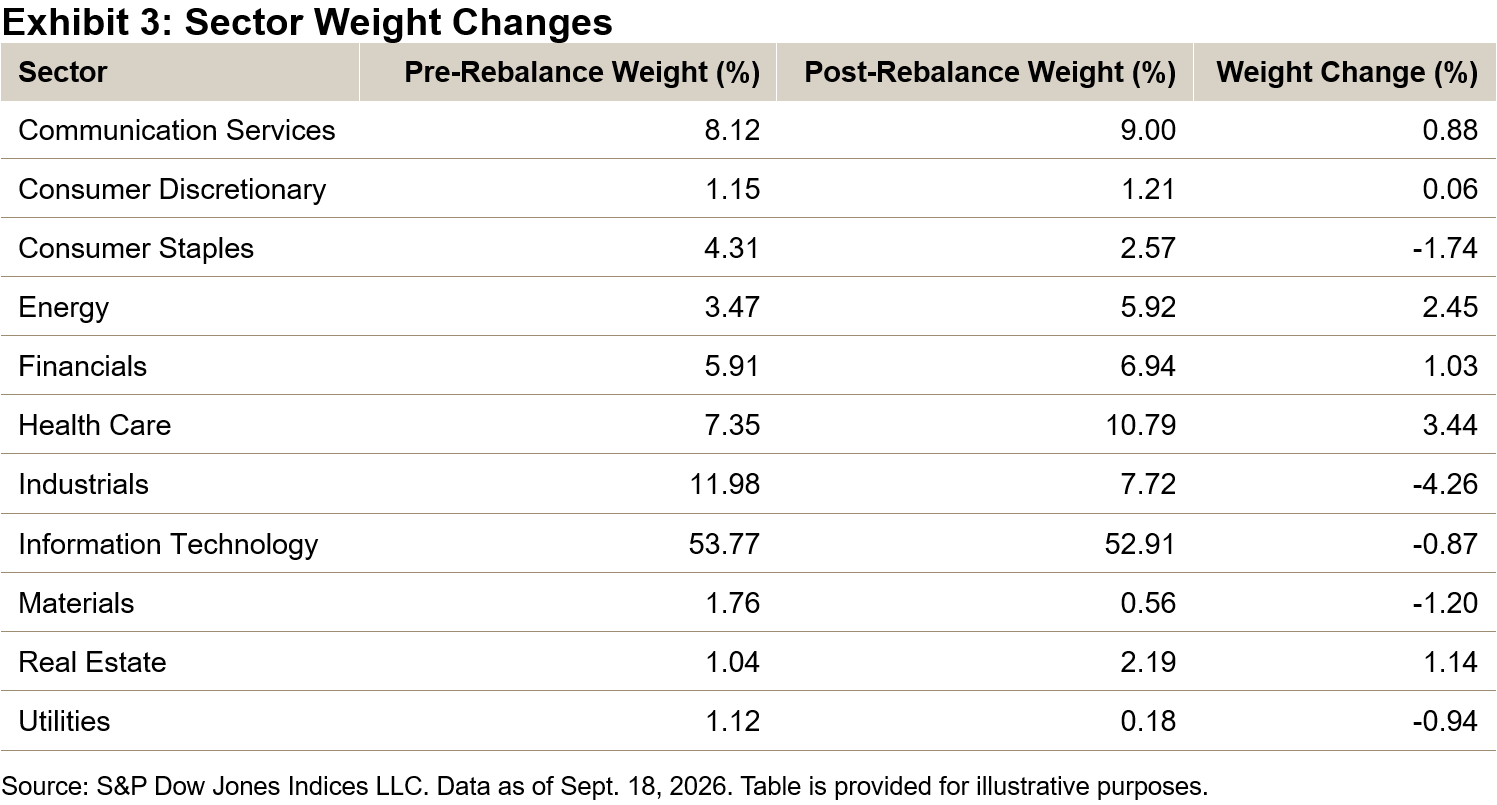
Information Technology remained the largest sector in the S&P 500 Momentum Index following the September rebalance, accounting for 52.91% of the weight. Health Care rose to become the second-largest sector, replacing Industrials, while the weights of all other sectors remained relatively unchanged.

Industry Group Breakdown

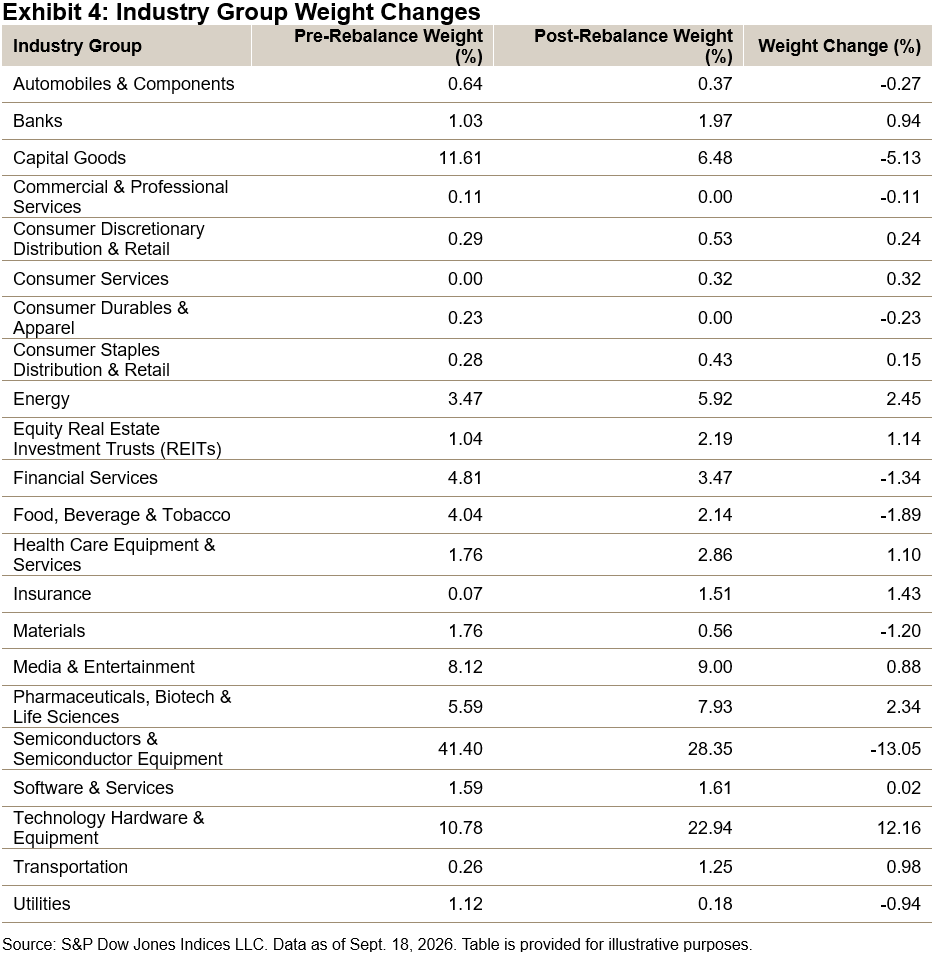
While overall weight of the Information Technology sector remained stable, its underlying industry weightings shifted significantly: the Semiconductor & Semiconductor Equipment industry group fell by 13.0%, while Technology Hardware & Equipment rose 12.1%, driven largely by Apple.

This rebalance reduced the index’s large overweight in semiconductors. Furthermore, Apple’s inclusion introduced potential diversification within AI-related themes, as its revenue is less directly tied to AI capital expenditures than that of major semiconductor firms.

Factor Tilts

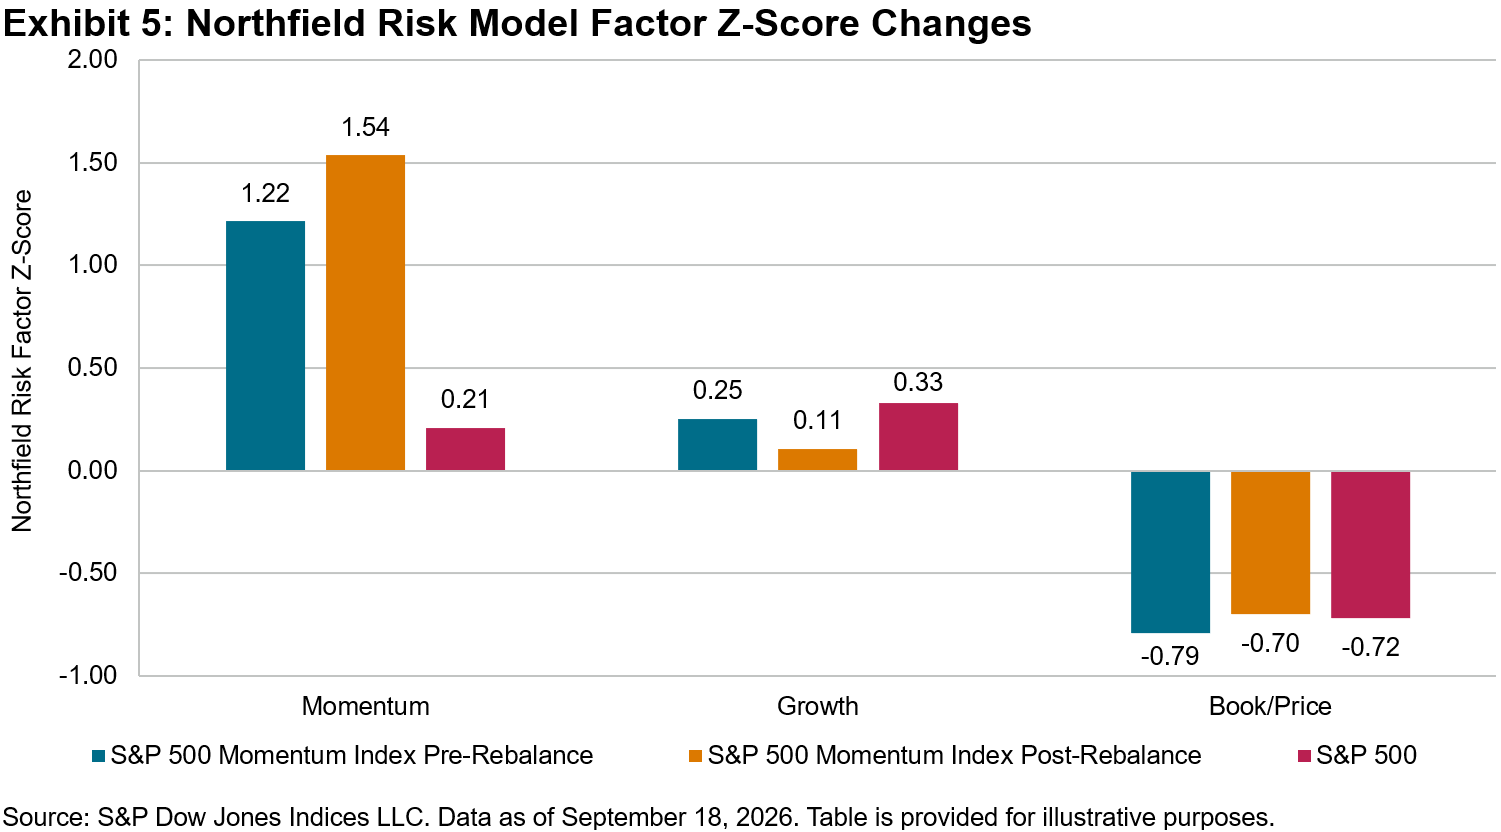
Exhibit 5 highlights the S&P 500 Momentum Index’s pre- and post-rebalance factor tilts relative to the S&P 500 using Northfield Risk Model Z-scores. As expected, the index exhibited a stronger momentum tilt following the rebalance, alongside a smaller growth tilt and an increased value tilt.

1 Please refer to the S&P Momentum Indices Methodology for more details.

The posts on this blog are opinions, not advice. Please read our Disclaimers.
The Evolution of the S&P USD Select Leveraged Loan Index

Contributor Image
Eric Pettinelli

Fixed Income Specialist, Index Investment Strategy

S&P Dow Jones Indices

Indices are constructed from components brought together by methodology and the market. Unlike stocks in an equity index, the constituents in the S&P USD Select Leveraged Loan Index are retired or reweighed as new loans are issued and existing loans are paid down. As a result, loan vintages from different years are mixed within the index and its composition evolves over time to reflect changes in the underlying credit market.

To illustrate how a loan benchmark evolves, we will examine the markedly different economic environments of December 2020 and June 2026 through the lens of the index and see how it responded to such changes.

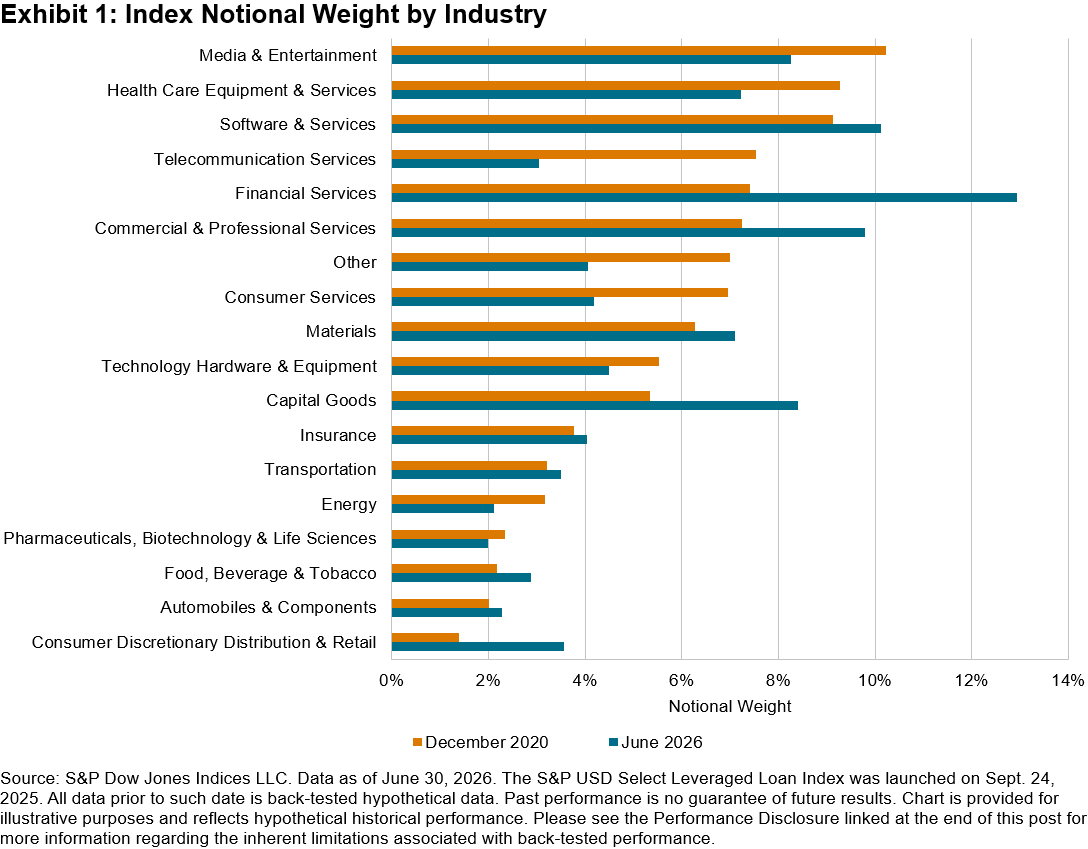
A helpful starting point is to assess industry concentration to see what types of companies are receiving public leveraged loans. Over this period, the S&P USD Select Leveraged Loan Index observed the largest relative shifts of weight into Financial Services and Capital Goods (see Exhibit 1). Both of these industries can be relatively capital intensive, so it is not surprising to see more loan volume flowing in to support these businesses.

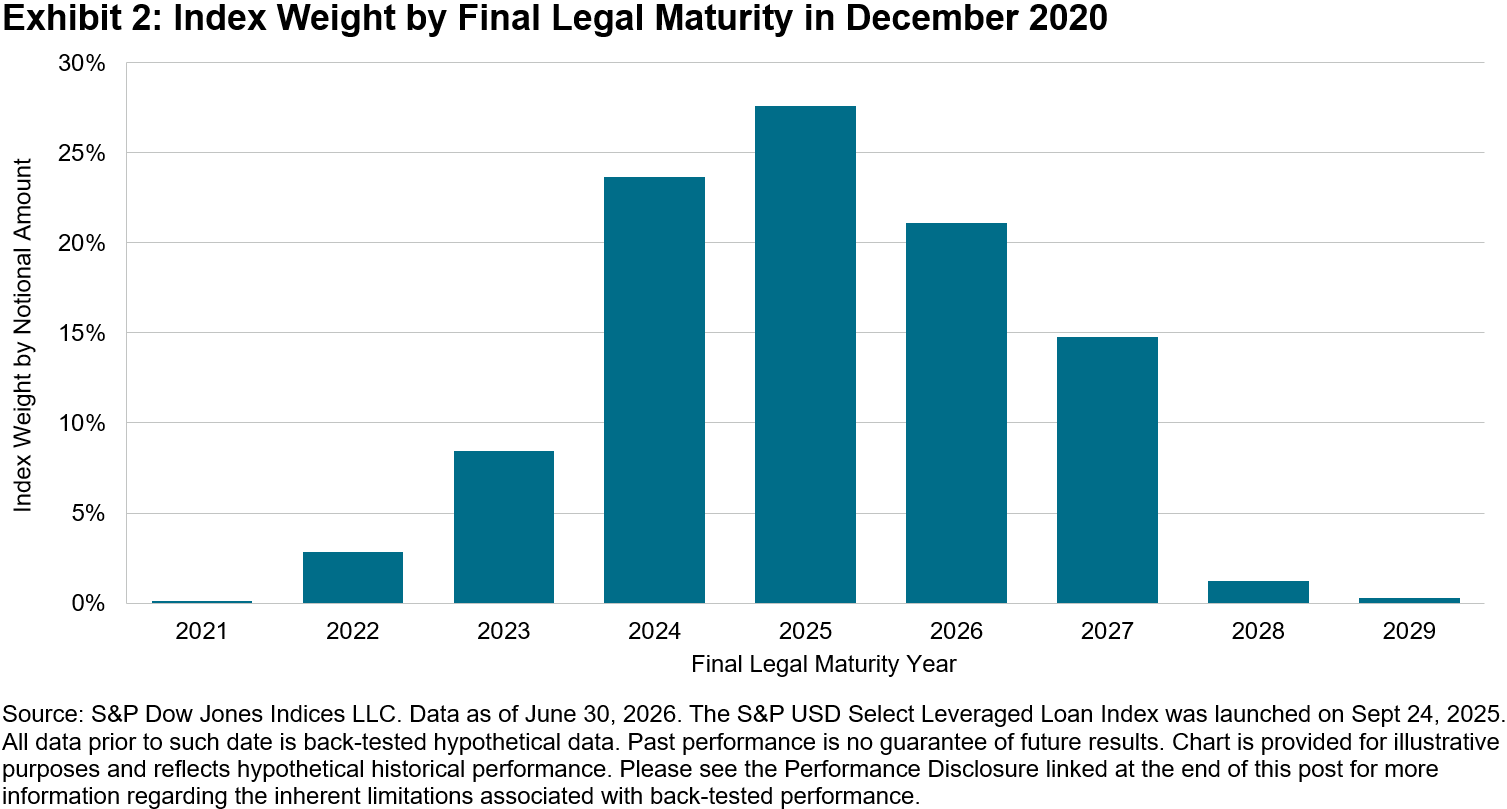
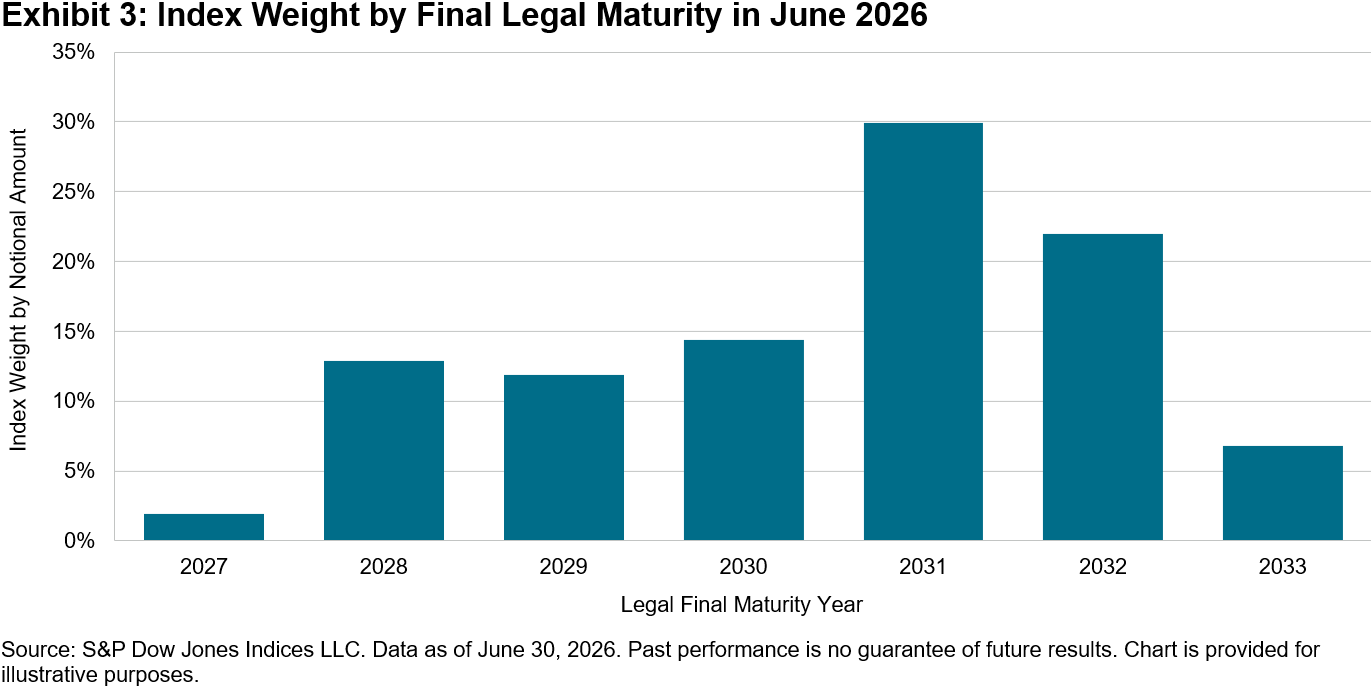
Another metric to review is how the loans’ maturities have changed over time. In the 2020 data, the final legal maturity follows a normal, bell-shaped distribution, which could have been the result of borrowers choosing not to aggressively refinance and instead allowing loans to mature in a low interest rate environment (see Exhibit 2). In contrast, the current maturity wall of the index has been pushed further out (see Exhibit 3).

These shifts in maturity may indicate a market that is pushing refinancing and loan repayment out over a longer time horizon. This suggests market participants may be reflecting concerns that, in the short term, the U.S. may see additional rate hikes from the Federal Funds current target of 3.50%-3.75% to combat inflation and that borrowers may seek to avoid refinancing in this environment.

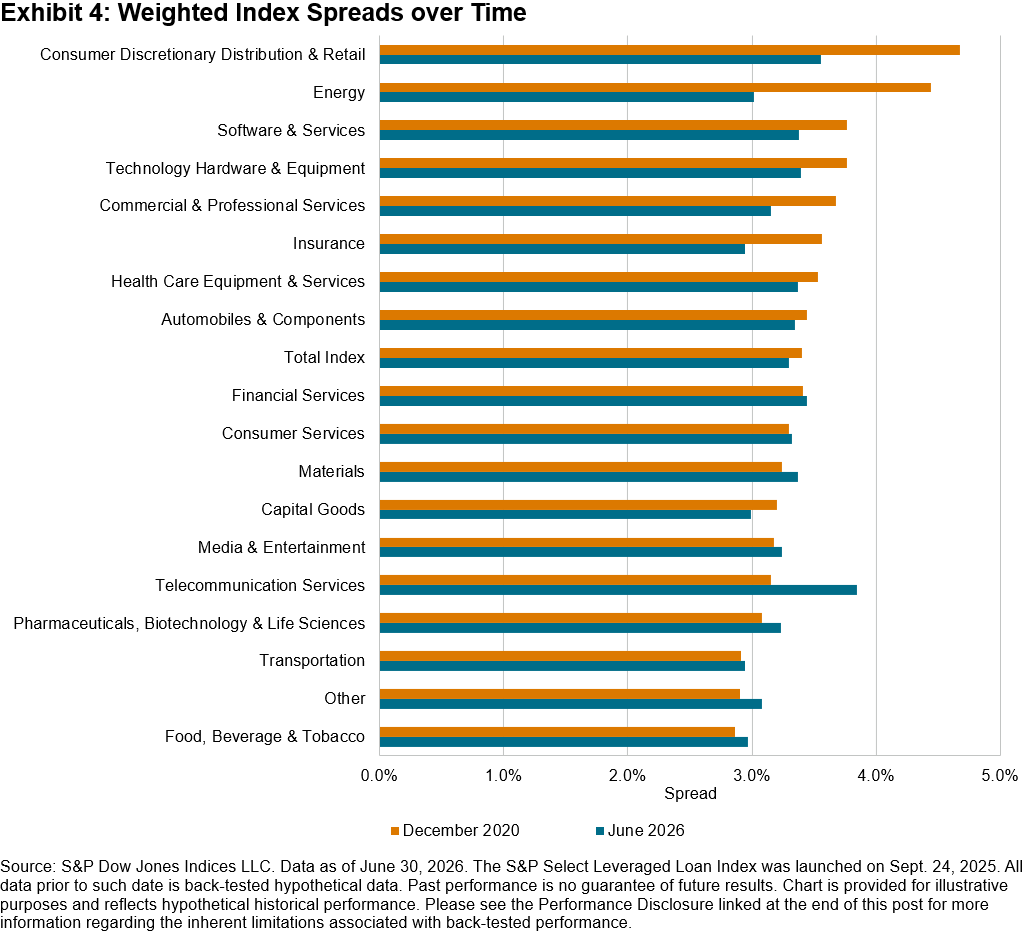
Despite differences in maturity and industry mix as well as the changing rate environment, spreads have not changed meaningfully over the period examined, which may be relevant to market participants seeking to deploy capital consistently and may help contextualize concerns about spread compression across the whole asset class (see Exhibit 4).

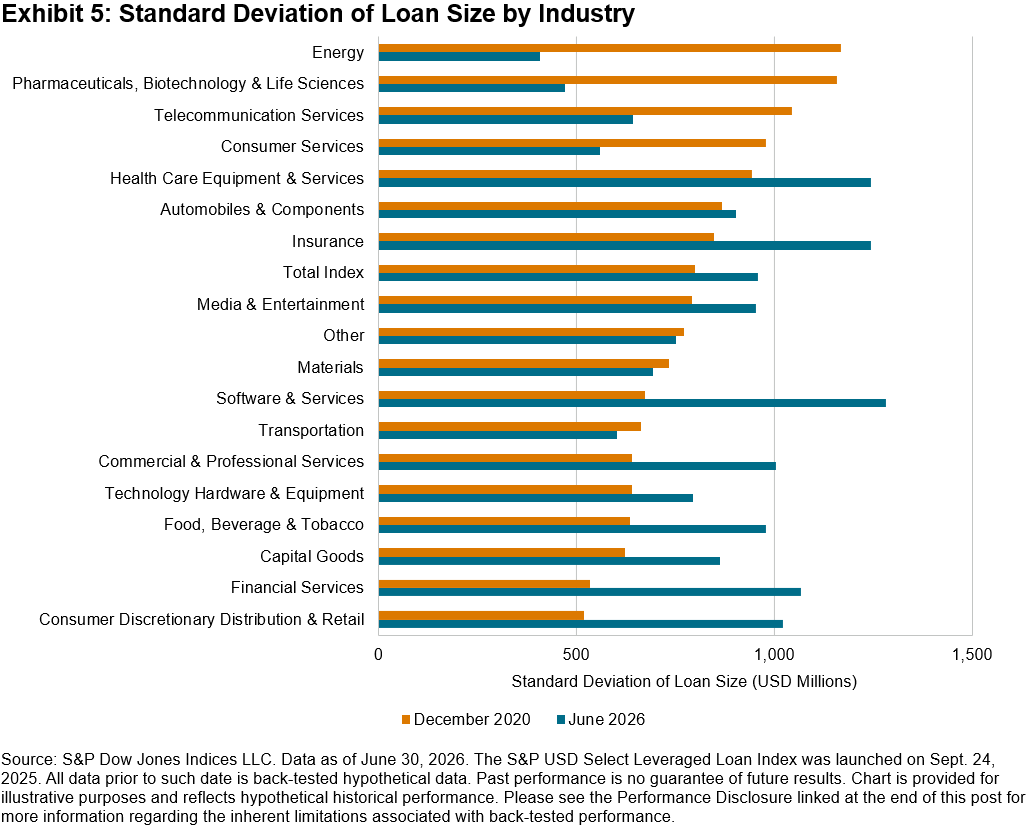
Lastly, while the distribution of index weight across industries is changing, the deviation in loan sizes across companies in the index can also be assessed to determine whether concentration risk is changing over time. In certain categories such as Software & Services, for example, there was a much higher standard deviation in June 2026 than in December 2020 (see Exhibit 5).

What can be derived from these exhibits is that while some characteristics of the index may change, others remained stable, showing how the asset class has evolved in response to changing economic conditions. Accordingly, the S&P USD Select Leveraged Loan Index continued to serve as a gauge of lending conditions and demonstrated stability across multiple dimensions.

This content may be AI-assisted and is composed, reviewed, edited, and approved by S&P Global.

The posts on this blog are opinions, not advice. Please read our Disclaimers.
Charting the Clean Energy Odyssey

Contributor Image
Myrna Ghanem

Associate Director,​ Sustainability Index Product Management​, Global Equities & Thematics

S&P Dow Jones Indices

In Homer’s Odyssey, the title character, Odysseus, spends years away from home fighting at Troy before making the challenging journey home to Ithaca. Sirens tempt him off course, lotus flowers cause his sailors to lose sight of their objective and storms repeatedly delay the voyage. The clean energy industry has faced its own odyssey: a long transition shaped by changing priorities, policy turns and geopolitical disruption.

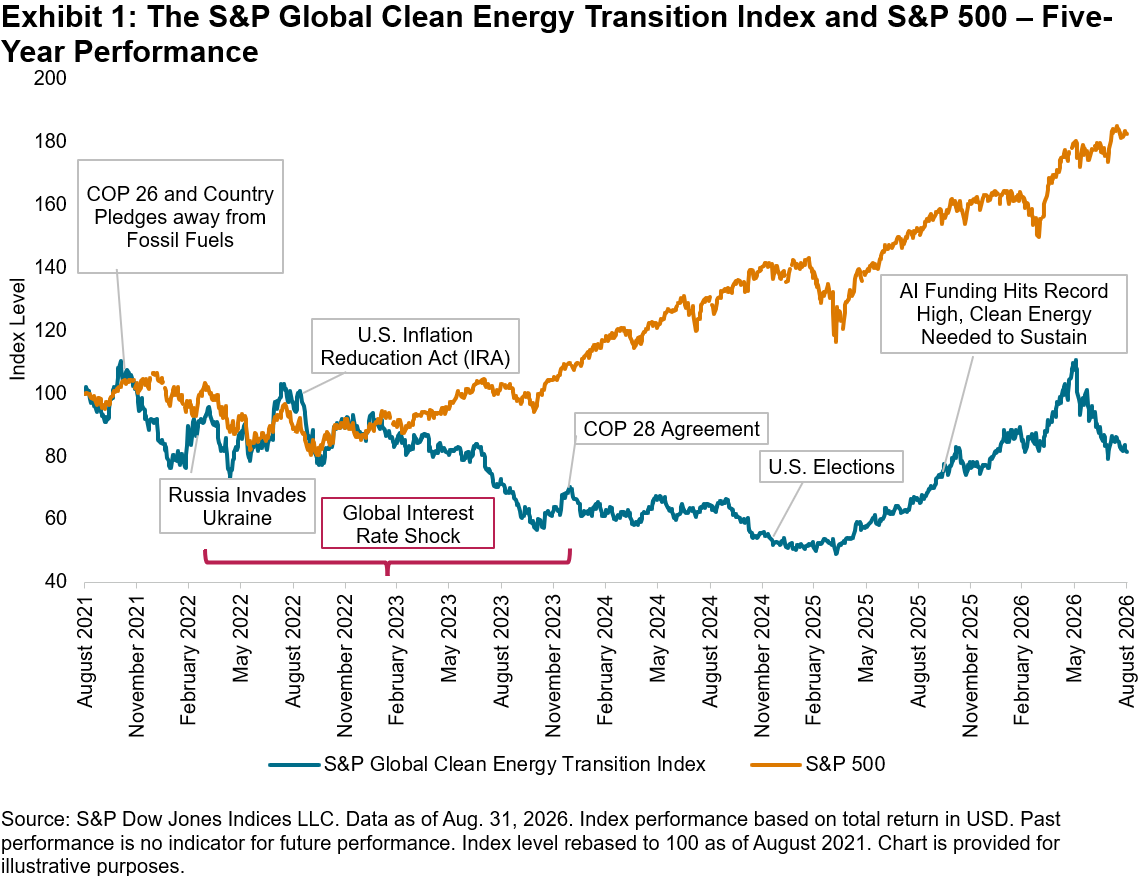
The S&P Global Clean Energy Transition Index has served as a compass throughout this journey. Launched in 2007, almost 20 years ago, it measures the performance of companies involved in clean energy-related businesses, spanning power generation and enabling technologies. Its history covers periods of market enthusiasm and retrenchment; it peaked in 2008, then declined over an extended period before rising again during the COVID-19 pandemic. Since 2021, the index has been rewired for greater transparency, expanded emerging markets coverage and stricter carbon reduction requirements.

Exhibit 1 illustrates its ongoing, choppy journey since then. Over the five-year period ending Aug. 31, 2026, the S&P Global Clean Energy Transition Index declined 4.1%, compared with a 12.8% gain for the S&P 500®. Higher interest rates created storms; shifting policy priorities acted like lotus flowers, pulling focus away from renewables back to fossil fuels; wars and geopolitical tensions posed obstacles; and the rise of artificial intelligence (AI) emerged as a new siren, commanding investor attention while also creating fresh opportunities for clean energy.

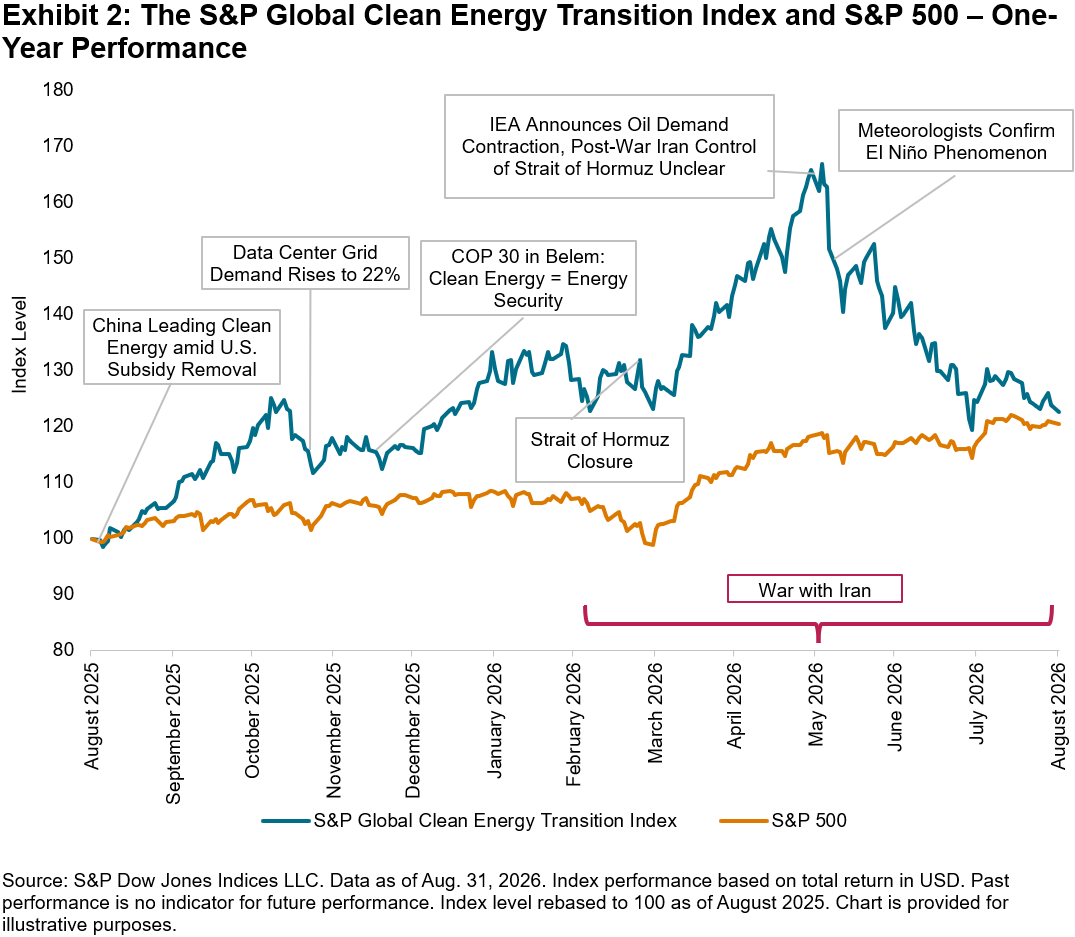
The one-year performance as seen in Exhibit 2 reflects the latter part of the tale. The S&P Global Clean Energy Transition Index gained 22.65% in the one-year period ending Aug. 31, 2026, outperforming the S&P 500. The war in the Middle East reinforced the importance of diversified energy sources and reduced dependence on geopolitically sensitive regions. In the U.S., the accelerated phaseout of key clean energy incentives compressed project timelines, prompting developers to rush to secure eligibility for their projects rather than causing an immediate slowdown in deployment. At the same time, clean energy is becoming a cornerstone in meeting AI’s growing hunger for power. Solar and energy storage are increasingly at the center of that buildout, with hyperscalers signing gigawatt-scale power agreements to secure the electricity needed for expanding data center infrastructure.

The maturity in the theme and industry is also reflected in S&P Global Energy’s Tier 1 Cleantech Companies List, bringing the focus back to the need for resilient infrastructure. Covering photovoltaic (PV) modules, PV inverters, wind turbines, energy storage systems and battery cells, the list identifies companies that meet rigorous criteria spanning market presence, scale, global diversification, financial performance, sustainability and credit risk.

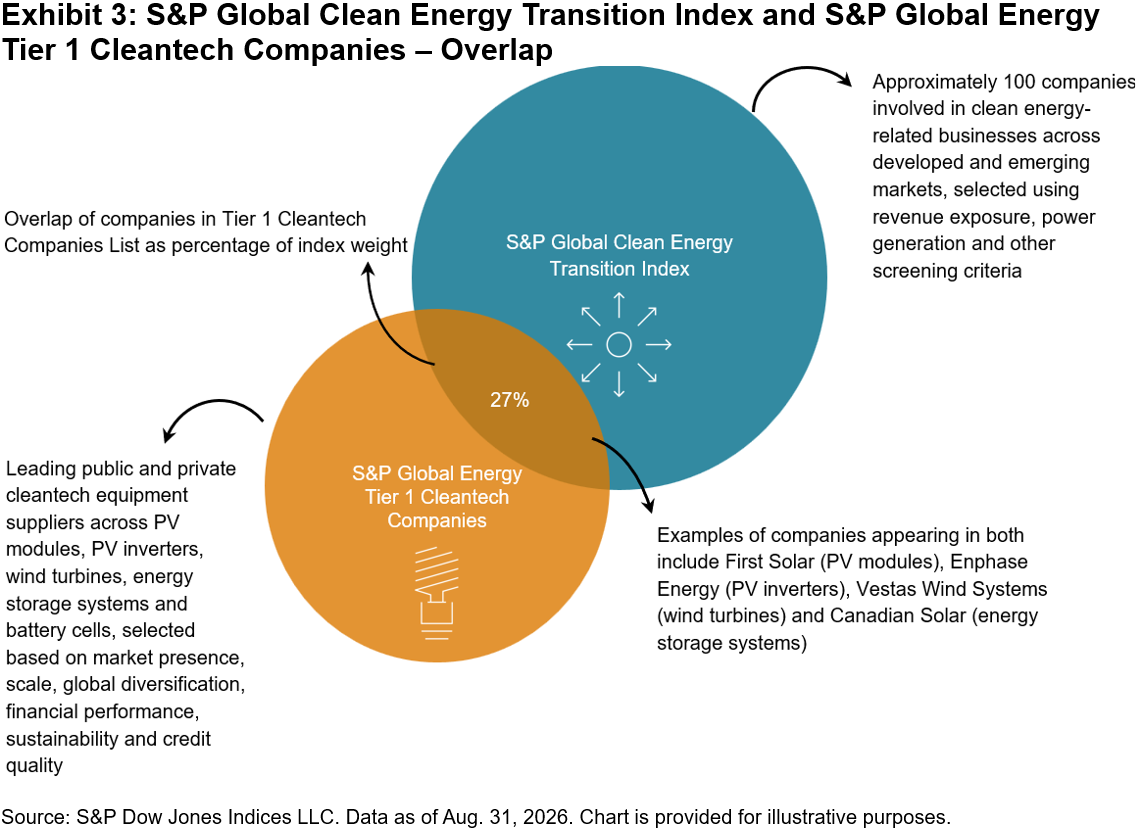
While the two universes serve different purposes—with the S&P Global Clean Energy Transition Index encompassing a broad range of clean energy activities and the Tier 1 Cleantech Companies List focusing on leading equipment suppliers across both public and private markets—there is notable overlap between them (see Exhibit 3). As the energy transition matures, supplier quality, operational resilience and long-term durability are becoming important components of clean energy system readiness.

The challenge is no longer simply adding renewable capacity; clean energy investment now exceeds fossil fuel equivalent by nearly 2 to 1, a gap that has widened over the past decade.1 Increasingly, what matters is converting generation into reliable, deliverable power through grid connections, permitting, storage, supportive regulation and suppliers capable of servicing equipment over an asset’s life. The clean energy investment case is expanding beyond clean generation to encompass the infrastructure nexus and need to produce, transmit, store and manage electricity.

Odysseus eventually reached home, but only after navigating Poseidon’s high seas. Unlike our hero, the clean energy industry does not have the luxury of divine guidance. Its next course will depend on resilience beyond power generation alone. Climate variability, including the potential for a strong El Niño, may increase the risk of heat, drought, flooding and wildfire, placing pressure on grids, water systems and supply chains. What the weather gods have in store remains uncertain; the S&P Global Clean Energy Transition Index and S&P Global Energy Tier 1 Cleantech Companies List offer a window into the companies helping build the raft for the journey ahead.

1 See Forbes, “Clean Energy Is Outspending Fossil Fuels Nearly Two To One,” June 7, 2026.

The posts on this blog are opinions, not advice. Please read our Disclaimers.
An Alternative Approach to Autocall Indices

Contributor Image
Parth Shah

Director, Derivative Indices

S&P Dow Jones Indices

We recently published the blog Indexing Autocalls, where we highlighted the continued investor demand for solutions that facilitate income generation—in particular, autocalls.

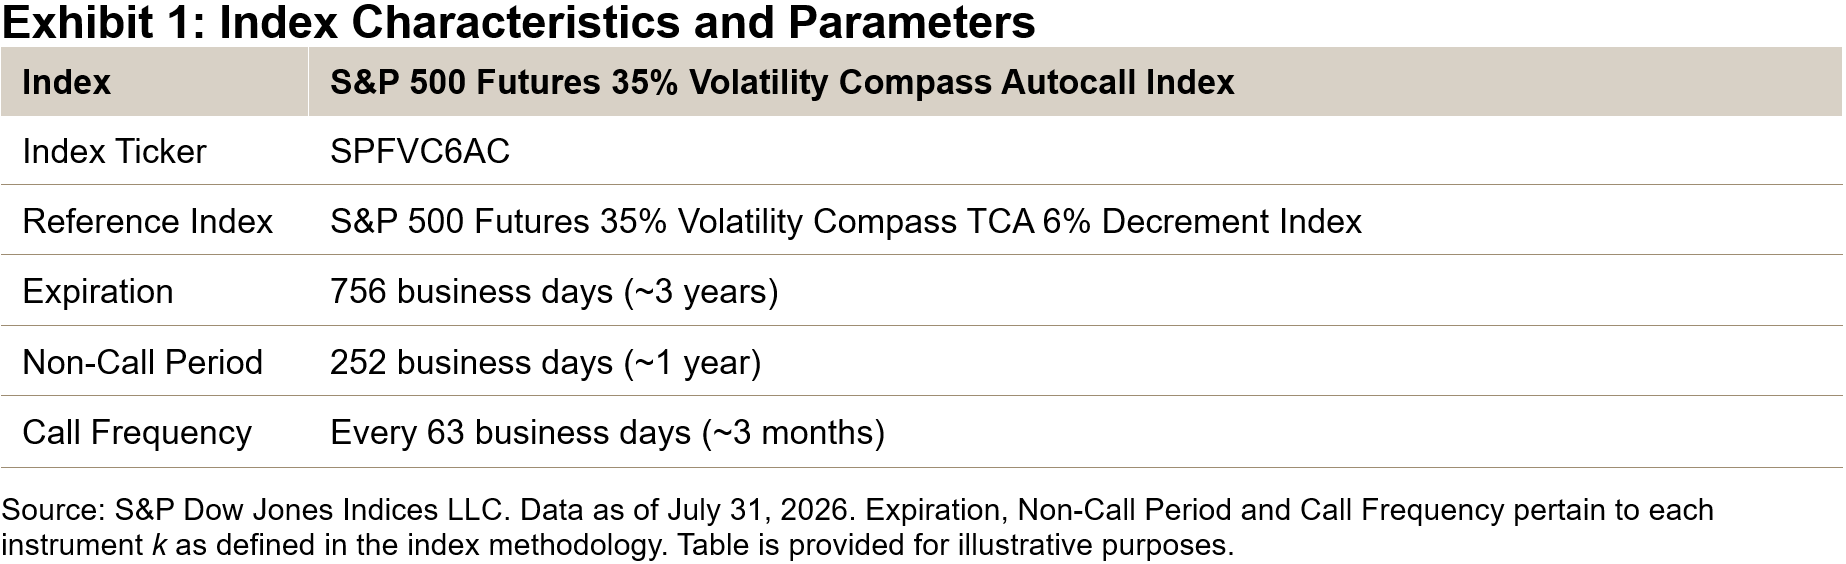
S&P Dow Jones Indices recently launched the S&P 500 Futures 35% Volatility Compass Autocall Index, which takes a unique approach to incorporating autocall features within an index framework. The index measures the performance of a continuously refreshing portfolio of hypothetical weekly issued put-barrier instruments on the S&P 500 Futures 35% Volatility Compass TCA 6% Decrement Index. Each instrument includes an autocall feature that allows for early redemption on a scheduled observation date if the index has recovered to, or exceeded, its level at issuance. In this way, the index seeks to generate hypothetical income through the premiums received from the issuance of new barrier instruments with an autocall feature, as opposed to fully replicating a hypothetical portfolio of autocall instruments.

Because an index is not an investment product, one cannot invest directly in an index but rather an investment product based on an index. As a result, descriptions of the index’s instruments and autocall features, for example, are hypothetical in nature.

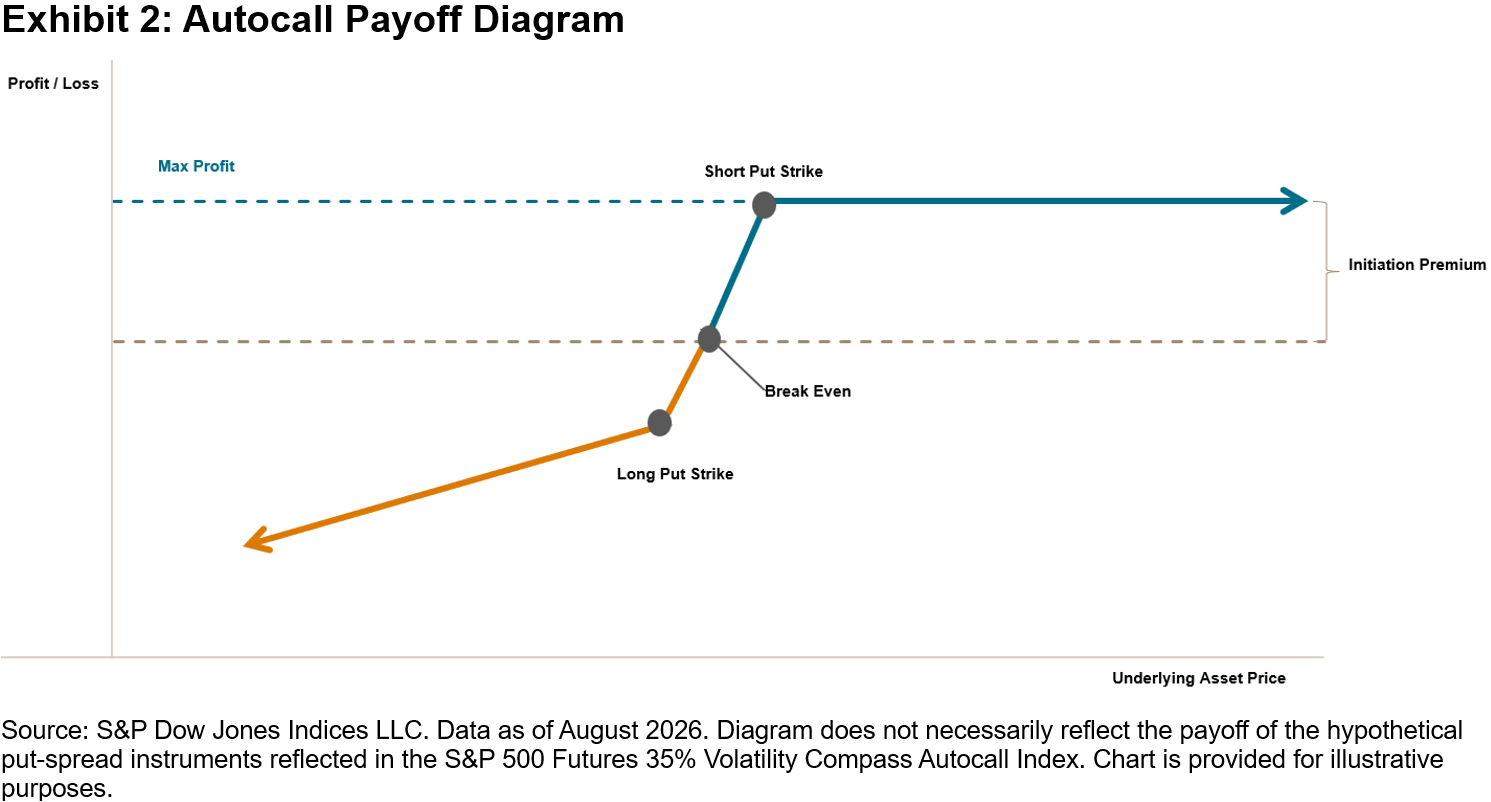
The S&P 500 Futures 35% Volatility Compass Autocall Index incorporates a laddered put-barrier structure designed to generate hypothetical income from option premiums. The put barrier is constructed using a short put struck at 65% of the initial index level and a long put struck at 63% of the initial index level to replicate the desired barrier payoff. By laddering issuances over time, the index seeks to reduce timing risk across varying market conditions. Overall, the structure seeks to provide limited downside and premium buffer protection, helping to mitigate moderate losses before the put-barrier level is reached.

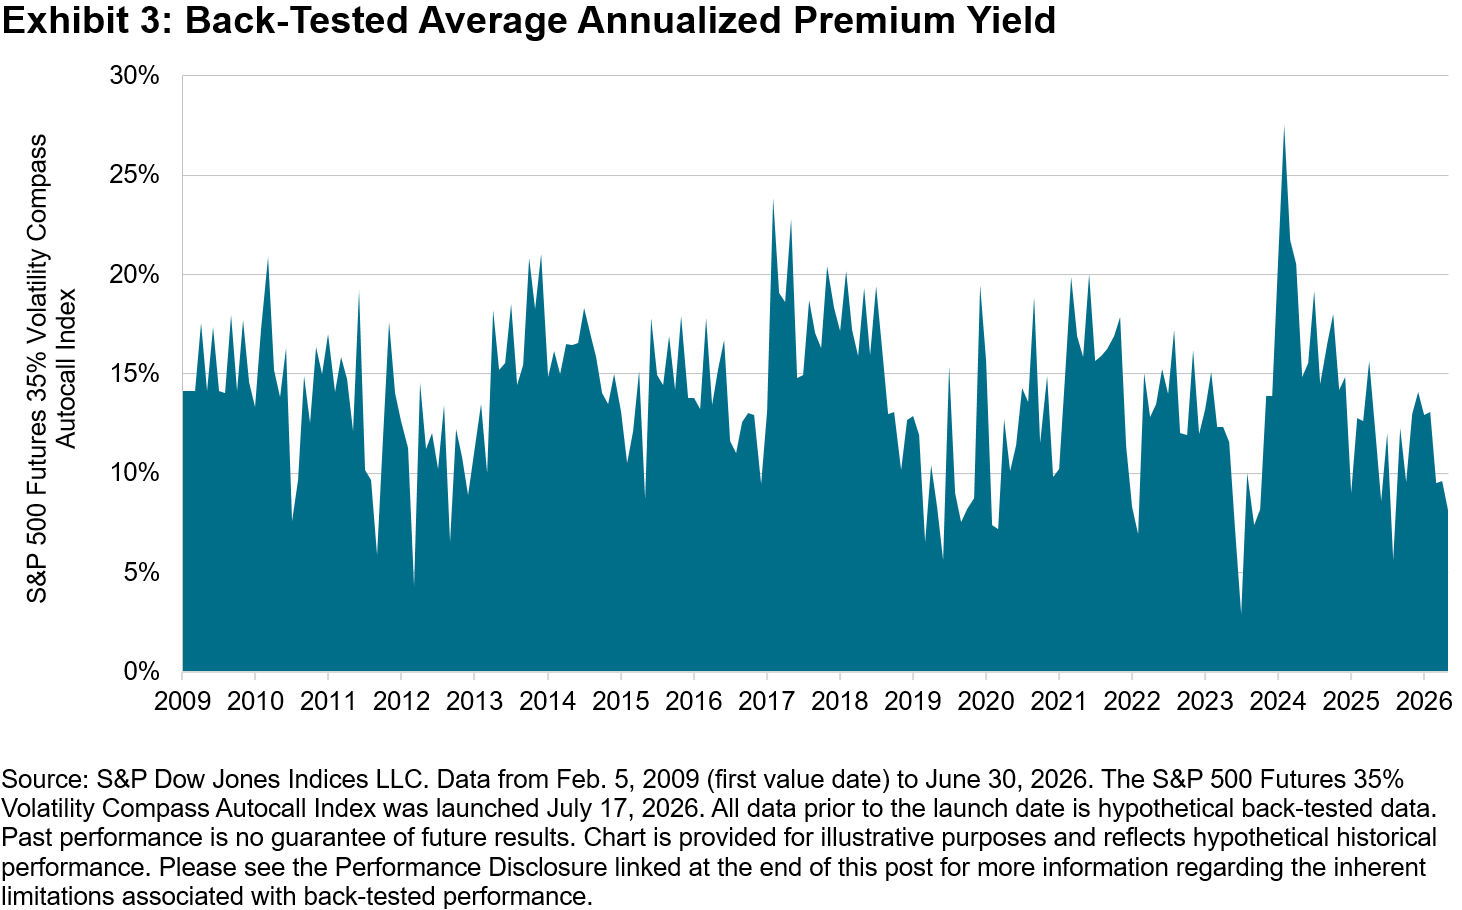
Because the S&P 500 Futures 35% Volatility Compass Autocall Index features an autocall mechanism, when the underlying index recovers to its issuance level, the relevant instrument can be redeemed early at fair value, allowing the portfolio to refresh rather than remain locked into the same position until final maturity. Additionally, new put-barrier instruments are issued on a recurring basis, creating a different yield profile compared to static option strategies.

As investor demand for income strategies remains strong, S&P DJI is committed to bring to market indices that reflect varied approaches to hypothetical income generation to a broader set of market participants.

The posts on this blog are opinions, not advice. Please read our Disclaimers.